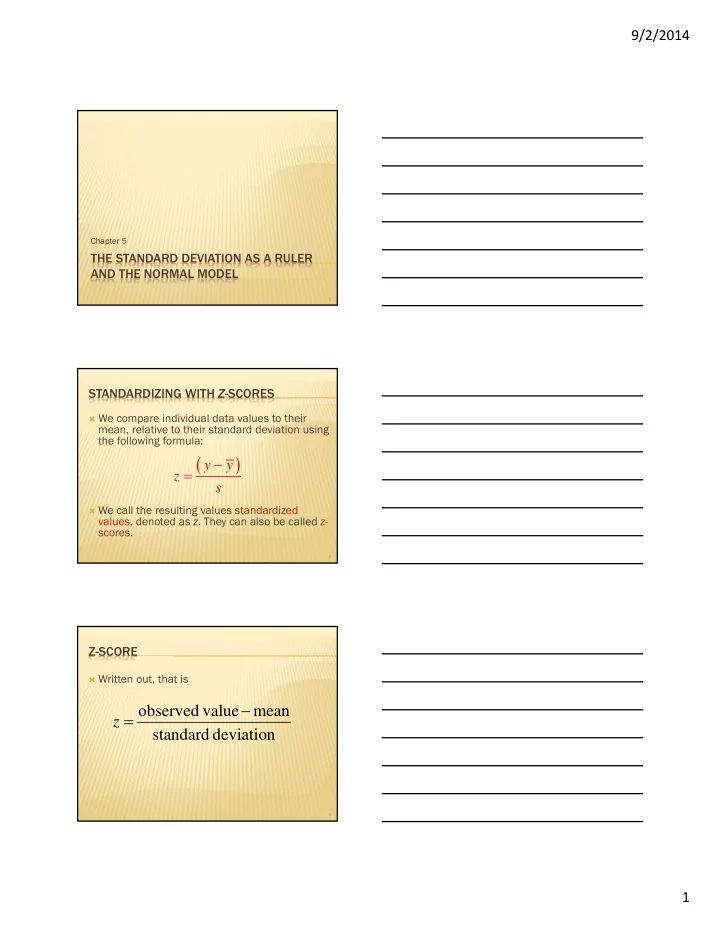

9/2/2014 Chapter 5 THE STANDARD DEVIATION AS A RULER AND THE NORMAL MODEL 1 STANDARDIZING WITH Z -SCORES We compare individual data values to their mean, relative to their standard deviation using the following formula: y y z s We call the resulting values standardized values, denoted as z . They can also be called z - scores. 2 Z-SCORE Written out, that is observed value mean z standard deviation 3 1
9/2/2014 STANDARDIZING WITH Z -SCORES Standardized values have no units. z -scores measure the distance of each data value from the mean in standard deviations. A negative z -score tells us that the data value is below the mean, while a positive z -score tells us that the data value is above the mean. 4 BENEFITS OF STANDARDIZING Standardized values have been converted from their original units to the standard statistical unit of standard deviations from the mean . Thus, we can compare values that are measured on different scales, with different units, or from different populations. 5 WHEN IS A Z -SCORE BIG? A z -score gives us an indication of how unusual a value is because it tells us how far it is from the mean. Remember that a negative z -score tells us that the data value is below the mean, while a positive z -score tells us that the data value is above the mean. The larger a z -score is (negative or positive), the more unusual it is. 6 2
9/2/2014 WHEN IS A Z -SCORE BIG? (CONT.) There is no universal standard for z -scores, but there is a model that shows up over and over in Statistics. This model is called the Normal model (You may have heard of “bell-shaped curves.”). Normal models are appropriate for distributions whose shapes are unimodal and roughly symmetric. These distributions provide a measure of how extreme a z -score is. 7 NORMAL DISTRIBUTION Retrieved from http://www.originlab.com/www/resources/graph_gallery/images_galleries/Histo.gif, January 27, 2010. 8 WHEN IS A Z -SCORE BIG? (CONT.) There is a Normal model for every possible combination of mean and standard deviation. We write N( μ , σ ) to represent a Normal model with a mean of μ and a standard deviation of σ . We use Greek letters because this mean and standard deviation do not come from data— they are numbers (called parameters) that specify the model. 9 3
9/2/2014 WHEN IS A Z -SCORE BIG? (CONT.) Summaries of data, like the sample mean and standard deviation, are written with Latin letters. Such summaries of data are called statistics. When we standardize Normal data, we still call the standardized value a z- score, and we write y z 10 WHEN IS A Z -SCORE BIG? (CONT.) Once we have standardized, we need only one model: The N (0,1) model is called the standard Normal model (or the standard Normal distribution). Be careful—don’t use a Normal model for just any data set, since standardizing does not change the shape of the distribution. 11 WHEN IS A Z -SCORE BIG? (CONT.) When we use the Normal model, we are assuming the distribution is Normal. We cannot check this assumption in practice, so we check the following condition: Nearly Normal Condition: The shape of the data’s distribution is unimodal and symmetric. This condition can be checked with a histogram or a Normal probability plot (explained in text). 12 4
9/2/2014 THE 68-95-99.7 RULE It turns out that in a Normal model: about 68% of the values fall within one standard deviation of the mean; about 95% of the values fall within two standard deviations of the mean; and, about 99.7% (almost all!) of the values fall within three standard deviations of the mean. 13 THE 68-95-99.7 RULE (CONT.) The following shows what the 68-95-99.7 Rule tells us: From Stats Modeling the World by Bock, Velleman, & De Veaux, 2010, p. 113. 14 FINDING NORMAL PERCENTILES BY HAND When a data value doesn’t fall exactly 1, 2, or 3 standard deviations from the mean, we can look it up in a table of Normal percentiles. Table Z in Appendix F provides us with normal percentiles, but many calculators and statistics computer packages provide these as well. 15 5
9/2/2014 FINDING NORMAL PERCENTILES BY HAND (CONT.) Table Z is the standard Normal table. We have to convert our data to z -scores before using the table. Figure 6.5 shows us how to find the area to the left when we have a z -score of 1.80: 16 From Stats Modeling the World by Bock, Velleman, & De Veaux, 2010, p. 117. FROM PERCENTILES TO SCORES: Z IN REVERSE Sometimes we start with areas and need to find the corresponding z -score or even the original data value. Example: What z -score represents the first quartile in a Normal model? 17 FROM PERCENTILES TO SCORES: Z IN REVERSE (CONT.) Look in Table Z for an area of 0.2500. The exact area is not there, but 0.2514 is pretty close. This figure is associated with z = -0.67, so the first quartile is 0.67 standard deviations below the mean. 18 6
Recommend
More recommend