
Gov 51: Summarizing Bivariate Relationships: Cross-tabs, - PowerPoint PPT Presentation
Gov 51: Summarizing Bivariate Relationships: Cross-tabs, Scatterplots, and Correlation Matthew Blackwell Harvard University 1 / 18 Efgect of assassination attempts 0 Boumedienne 41 -9 ## polityafter interwarbefore ## 1 -6.00 0 ## 2
Gov 51: Summarizing Bivariate Relationships: Cross-tabs, Scatterplots, and Correlation Matthew Blackwell Harvard University 1 / 18
Efgect of assassination attempts 0 Boumedienne 41 -9 ## polityafter interwarbefore ## 1 -6.00 0 ## 2 -7.33 ## 3 ## 6 1968 -8.00 0 ## 4 -9.00 0 ## 5 -9.00 0 ## 6 -9.00 0 Algeria -9 leaders <- read.csv(”data/leaders.csv”) -6 head(leaders[, 1:7]) ## year country leadername age politybefore ## 1 1929 Afghanistan Habibullah Ghazi 39 -6 ## 2 1933 Afghanistan Nadir Shah 53 ## 3 1934 Afghanistan 36 Hashim Khan 50 -6 ## 4 1924 Albania Zogu 29 0 ## 5 1931 Albania Zogu 2 / 18
Contingency tables ## • Quick summary how the two variables “go together.” 27 27 1 ## 19 0 177 1 • With two categorical variables, we can create contingency tables . 0 ## Before After ## After = leaders$civilwarafter) table(Before = leaders$civilwarbefore, • Rows are the values of one variable, columns the other. • Also known as cross-tabs 3 / 18
Contingency tables ## • Quick summary how the two variables “go together.” 27 27 1 ## 19 0 177 1 • With two categorical variables, we can create contingency tables . 0 ## Before After ## After = leaders$civilwarafter) table(Before = leaders$civilwarbefore, • Rows are the values of one variable, columns the other. • Also known as cross-tabs 3 / 18
Contingency tables ## • Quick summary how the two variables “go together.” 27 27 1 ## 19 0 177 1 • With two categorical variables, we can create contingency tables . 0 ## Before After ## After = leaders$civilwarafter) table(Before = leaders$civilwarbefore, • Rows are the values of one variable, columns the other. • Also known as cross-tabs 3 / 18
Contingency tables ## • Quick summary how the two variables “go together.” 27 27 1 ## 19 0 177 1 • With two categorical variables, we can create contingency tables . 0 ## Before After ## After = leaders$civilwarafter) table(Before = leaders$civilwarbefore, • Rows are the values of one variable, columns the other. • Also known as cross-tabs 3 / 18
Contingency tables ## • Quick summary how the two variables “go together.” 27 27 1 ## 19 0 177 1 • With two categorical variables, we can create contingency tables . 0 ## Before After ## After = leaders$civilwarafter) table(Before = leaders$civilwarbefore, • Rows are the values of one variable, columns the other. • Also known as cross-tabs 3 / 18
Cross-tabs with proportions prop.table(table(Before = leaders$civilwarbefore, 1 0.5000 0.5000 ## 0 0.9031 0.0969 ## 1 0 ## Before After ## margin = 1) After = leaders$civilwarafter), • We can also ask R to calculate proportions within each row: • Use the prop.table() for proportions: 1 0.108 0.108 ## 0 0.708 0.076 ## 1 0 ## Before After ## After = leaders$civilwarafter)) prop.table(table(Before = leaders$civilwarbefore, 4 / 18
Cross-tabs with proportions prop.table(table(Before = leaders$civilwarbefore, 1 0.5000 0.5000 ## 0 0.9031 0.0969 ## 1 0 ## Before After ## margin = 1) After = leaders$civilwarafter), • We can also ask R to calculate proportions within each row: • Use the prop.table() for proportions: 1 0.108 0.108 ## 0 0.708 0.076 ## 1 0 ## Before After ## After = leaders$civilwarafter)) prop.table(table(Before = leaders$civilwarbefore, 4 / 18
Cross-tabs with proportions prop.table(table(Before = leaders$civilwarbefore, 1 0.5000 0.5000 ## 0 0.9031 0.0969 ## 1 0 ## Before After ## margin = 1) After = leaders$civilwarafter), • We can also ask R to calculate proportions within each row: • Use the prop.table() for proportions: 1 0.108 0.108 ## 0 0.708 0.076 ## 1 0 ## Before After ## After = leaders$civilwarafter)) prop.table(table(Before = leaders$civilwarbefore, 4 / 18
Cross-tabs with proportions prop.table(table(Before = leaders$civilwarbefore, 1 0.5000 0.5000 ## 0 0.9031 0.0969 ## 1 0 ## Before After ## margin = 1) After = leaders$civilwarafter), • We can also ask R to calculate proportions within each row: • Use the prop.table() for proportions: 1 0.108 0.108 ## 0 0.708 0.076 ## 1 0 ## Before After ## After = leaders$civilwarafter)) prop.table(table(Before = leaders$civilwarbefore, 4 / 18
Cross-tabs with proportions prop.table(table(Before = leaders$civilwarbefore, 1 0.5000 0.5000 ## 0 0.9031 0.0969 ## 1 0 ## Before After ## margin = 1) After = leaders$civilwarafter), • We can also ask R to calculate proportions within each row: • Use the prop.table() for proportions: 1 0.108 0.108 ## 0 0.708 0.076 ## 1 0 ## Before After ## After = leaders$civilwarafter)) prop.table(table(Before = leaders$civilwarbefore, 4 / 18
Cross-tabs with proportions prop.table(table(Before = leaders$civilwarbefore, 1 0.5000 0.5000 ## 0 0.9031 0.0969 ## 1 0 ## Before After ## margin = 1) After = leaders$civilwarafter), • We can also ask R to calculate proportions within each row: • Use the prop.table() for proportions: 1 0.108 0.108 ## 0 0.708 0.076 ## 1 0 ## Before After ## After = leaders$civilwarafter)) prop.table(table(Before = leaders$civilwarbefore, 4 / 18
Scatterplot • Direct graphical comparison of two continuous variables. 5 / 18
Scatterplot • Direct graphical comparison of two continuous variables. 5 / 18 Democracy Before and After Assassination Attempts 10 5 Democracy Level (After) 0 -5 -10 -10 -5 0 5 10 Democracy Level (Before)
• Use the plot() function How to create a scatterplot • Each point on the scatterplot ( 𝘺 𝘫 , 𝘻 𝘫 ) plot(x = leaders$politybefore, y = leaders$polityafter, xlab = ”Democracy Level (Before)”, ylab = ”Democracy Level (After)”, main = ”Democracy Before and After Assassination Attempts”) 6 / 18
How to create a scatterplot • Each point on the scatterplot ( 𝘺 𝘫 , 𝘻 𝘫 ) • Use the plot() function plot(x = leaders$politybefore, y = leaders$polityafter, xlab = ”Democracy Level (Before)”, ylab = ”Democracy Level (After)”, main = ”Democracy Before and After Assassination Attempts”) 6 / 18
How to create a scatterplot • Each point on the scatterplot ( 𝘺 𝘫 , 𝘻 𝘫 ) • Use the plot() function plot(x = leaders$politybefore, y = leaders$polityafter, xlab = ”Democracy Level (Before)”, ylab = ”Democracy Level (After)”, main = ”Democracy Before and After Assassination Attempts”) 6 / 18
Scatterplot leaders[1, c(”politybefore”, ”polityafter”)] ## politybefore polityafter ## 1 -6 -6 7 / 18
Scatterplot leaders[1, c(”politybefore”, ”polityafter”)] ## politybefore polityafter ## 1 -6 -6 7 / 18
Scatterplot -6 leaders[1, c(”politybefore”, ”polityafter”)] -6 7 / 18 ## 1 politybefore polityafter ## Democracy Before and After Assassination Attempts 10 5 Democracy Level (After) 0 -5 -10 -10 -5 0 5 10 Democracy Level (Before)
Scatterplot -6 leaders[1, c(”politybefore”, ”polityafter”)] -6 8 / 18 ## 1 politybefore polityafter ## Democracy Before and After Assassination Attempts 10 5 Democracy Level (After) 0 -5 -10 -10 -5 0 5 10 Democracy Level (Before)
Scatterplot -6 leaders[2, c(”politybefore”, ”polityafter”)] -7.33 9 / 18 ## 2 politybefore polityafter ## Democracy Before and After Assassination Attempts 10 5 Democracy Level (After) 0 -5 -10 -10 -5 0 5 10 Democracy Level (Before)
Scatterplot -6 leaders[3, c(”politybefore”, ”polityafter”)] -8 10 / 18 ## 3 politybefore polityafter ## Democracy Before and After Assassination Attempts 10 5 Democracy Level (After) 0 -5 -10 -10 -5 0 5 10 Democracy Level (Before)
Scatterplot -6 leaders[3, c(”politybefore”, ”polityafter”)] -8 11 / 18 ## 3 politybefore polityafter ## Democracy Before and After Assassination Attempts 10 5 Democracy Level (After) 0 -5 -10 -10 -5 0 5 10 Democracy Level (Before)
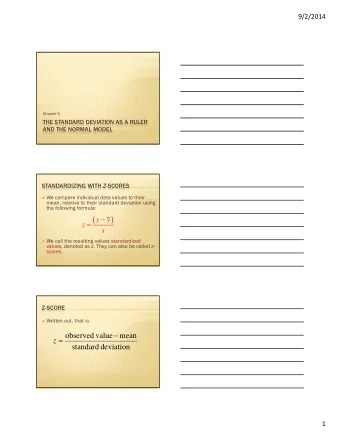
𝘺 𝘫 − mean of 𝘺 z-score of 𝘺 𝘫 = z-score of ( 𝘣𝘺 𝘫 + 𝘤 ) = z-score of 𝘺 𝘫 How big is big? • Would be nice to have a standard summary of how similar variables are. • Problem: variables on difgerent scales! • Need a way to put any variable on common units. • z-score to the rescue! standard deviation of 𝘺 • Crucial property: z-scores don’t depend on units 12 / 18
𝘺 𝘫 − mean of 𝘺 z-score of 𝘺 𝘫 = z-score of ( 𝘣𝘺 𝘫 + 𝘤 ) = z-score of 𝘺 𝘫 How big is big? • Would be nice to have a standard summary of how similar variables are. • Problem: variables on difgerent scales! • Need a way to put any variable on common units. • z-score to the rescue! standard deviation of 𝘺 • Crucial property: z-scores don’t depend on units 12 / 18
𝘺 𝘫 − mean of 𝘺 z-score of 𝘺 𝘫 = z-score of ( 𝘣𝘺 𝘫 + 𝘤 ) = z-score of 𝘺 𝘫 How big is big? • Would be nice to have a standard summary of how similar variables are. • Problem: variables on difgerent scales! • Need a way to put any variable on common units. • z-score to the rescue! standard deviation of 𝘺 • Crucial property: z-scores don’t depend on units 12 / 18
Recommend


More recommend
Explore More Topics
Stay informed with curated content and fresh updates.