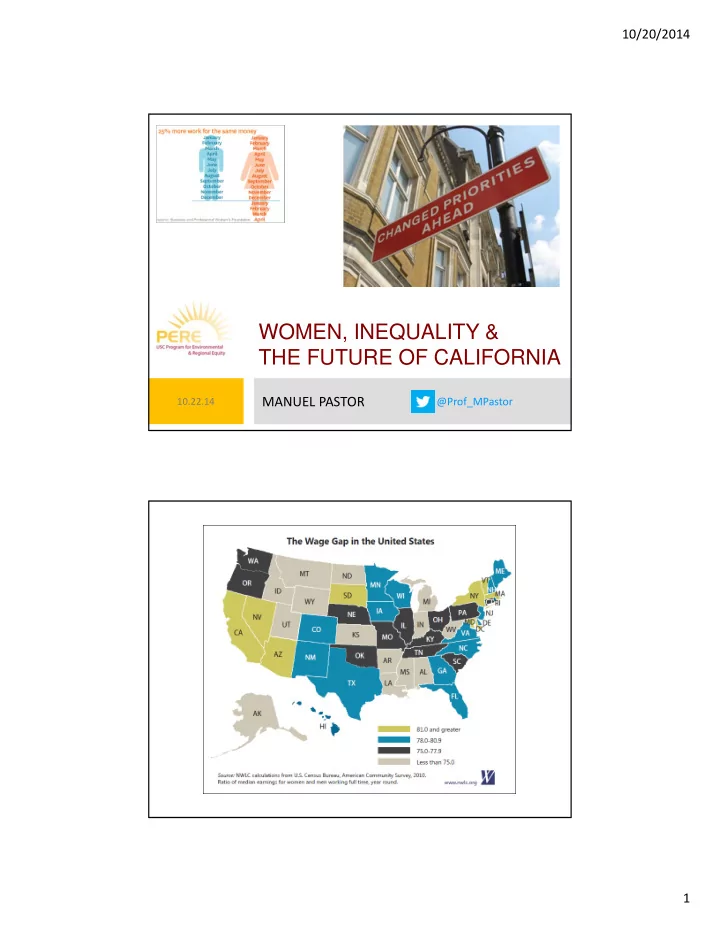

10/20/2014 WOMEN, INEQUALITY & THE FUTURE OF CALIFORNIA MANUEL PASTOR @Prof_MPastor 10.22.14 1
10/20/2014 Changing Demographics California, 1980 ‐ 2040 100% 3% 3% 3% 3% 3% 5% 9% 11% 90% 13% Other 14% 14% 14% 19% 80% Native American 26% 70% 8% 32% 38% Asian/Pacific 41% 7% 43% 60% 45% Islander 50% Latino 6% 6% 40% 6% Black 5% 5% 67% 30% 57% White 47% 20% 40% 37% 34% 32% 10% 0% 1980 1990 2000 2010 2020 2030 2040 2
10/20/2014 3
10/20/2014 Median Hourly Wage by Education Level California, 2006-2010 Full ‐ time Wage & Salary Workers Only (Ages 25 ‐ 64) White Women $40 White Men, $40 Black Women Latina Women $35 Asian/Pacific Islander Women White Men $30 Black Men Latino Men $25 Asian/Pacific Islander Men $20 $15 $10 Latina Women, $9 $5 Less than a HS Diploma, More than HS Diploma but BA Degree HS Diploma no College less than BA Degree or higher 4
10/20/2014 Poverty Statistics – Female-headed Households California, 2006-2010 Ca California All families Married-couple families Female householder, no husband Total Percent below Total Percent below Total Percent below poverty level poverty level poverty level Families Fa es 8,495,322 10.2% 6,166,334 6.1% 1,615,112 24.6% With related children under 18 years 4,629,191 15.1% 3,169,964 8.7% 1,058,722 32.8% RA RACE A AND H HISPAN ANIC IC OR OR LATINO OR ORIG IGIN IN Families with a householder who is-- One race 8,301,406 10.2% 6,037,918 6.1% 1,566,914 24.6% White 5,447,834 8.2% 4,141,406 5.0% 899,165 21.9% Black or African American 503,157 16.7% 229,409 5.4% 218,457 28.4% American Indian and Alaska Native 66,475 16.7% 41,170 9.6% 17,534 32.2% Asian 1,122,706 7.8% 885,041 5.9% 158,382 17.0% Native Hawaiian and Other Pacific Islander 30,307 10.2% 21,180 6.7% 6,037 20.5% Some other race 1,130,927 18.7% 719,712 12.9% 267,339 34.8% Two or more races 193,916 10.9% 128,416 5.6% 48,198 23.8% Hispanic or Latino origin (of any race) 2,714,013 17.8% 1,770,229 12.4% 629,741 33.5% White alone, not Hispanic or Latino 3,967,947 4.9% 3,155,984 2.7% 564,229 15.4% Householder worked 6,433,849 7.5% 4,683,715 4.5% 1,157,167 18.1% Householder worked full-time, year-round 4,363,296 3.7% 3,247,226 2.7% 702,875 7.5% EDU EDUCATIO IONAL A L ATTA TTAINMENT O OF HO HOUSEHOLDE DER Less than high school graduate 1,529,745 24.5% 989,949 18.2% 363,537 42.7% High school graduate (includes equivalency) 1,634,668 13.0% 1,084,010 7.7% 372,323 27.6% Some college, associate's degree 2,625,401 7.8% 1,835,196 3.7% 574,311 20.0% Bachelor's degree or higher 2,705,508 2.8% 2,257,179 2.0% 304,941 8.1% NUMBER OF R RELA LATE TED C D CHILDR DREN U UNDE DER 18 YEARS No child 3,866,131 4.4% 2,996,370 3.3% 556,390 9.0% 1 or 2 children 3,589,930 11.8% 2,430,181 6.1% 834,838 27.1% 3 or 4 children 942,181 24.7% 675,348 16.0% 198,676 52.2% 5 or more children 97,080 42.4% 64,435 31.7% 25,208 68.4% Poverty Statistics – Female-headed Households California, 2006-2010 Percentage of children below poverty line: 19% • Share of children in poverty living in FHH: 47% • Share of children living in FHH: 22% • Share of children living in MC below poverty line: 11% • Share of children living in FHH below poverty line: 40% • • MC = married-couple household; FHH = female-headed household • Note: Rates have only increased post- Great Recession 5
10/20/2014 6
10/20/2014 7
So urc e : U 10% 20% 30% 40% 50% 60% 70% 0% .S. Ce nsus B 61% Apparel Manufacturing 51% ure au. No te s: Are as in white are missing data. Leather and Allied Product Manufacturing 43% Non manufacturing 43% Printing and Related Support Activities Percent Women in Manufacturing (3 ‐ Digit NAICS Level) 42% Textile Product Mills 40% Miscellaneous Manufacturing 39% Food Manufacturing 36% Textile Mills 36% Chemical Manufacturing 34% Plastics and Rubber Products Manufacturing 34% Computer and Electronic Product Manufacturing Electrical Equipment, Appliance, and Component 33% Manufacturing 29% Furniture and Related Product Manufacturing 28% Beverage and Tobacco Product Manufacturing 26% Paper Manufacturing 25% Transportation Equipment Manufacturing 23% Nonmetallic Mineral Product Manufacturing 22% Machinery Manufacturing 20% Wood Product Manufacturing 20% Petroleum and Coal Products Manufacturing 20% Fabricated Metal Product Manufacturing 15% Primary Metal Manufacturing 10/20/2014 8
10/20/2014 Employment and Median Earnings of Women, by Industry, 2008 ‐ 2012 9
10/20/2014 Percent Women in Manufacturing and Non ‐ Manufacturing, 2012 Reducing the Gender Wage Gap • Address gender bias in male-centric industries (such as manufacturing) • Promote workplace flexibility, workplace sponsorship, and personal development • Encourage greater inclusion of women within STEM programs and careers – diversify higher education achievement * http://www.nwlc.org/resource/fair ‐ pay ‐ women ‐ requires ‐ increasing ‐ minimum ‐ wage ‐ and ‐ tipped ‐ minimum ‐ wage 10
10/20/2014 Reducing the Gender Wage Gap • Raise the minimum wage- a disproportionate share of women work minimum wage jobs* • Facilitate unionization: pathway to reducing the wage gap • Support single mothers completing community college • Protect immigrant rights, including administrative relief * http://www.nwlc.org/resource/fair ‐ pay ‐ women ‐ requires ‐ increasing ‐ minimum ‐ wage ‐ and ‐ tipped ‐ minimum ‐ wage 11
Recommend
More recommend