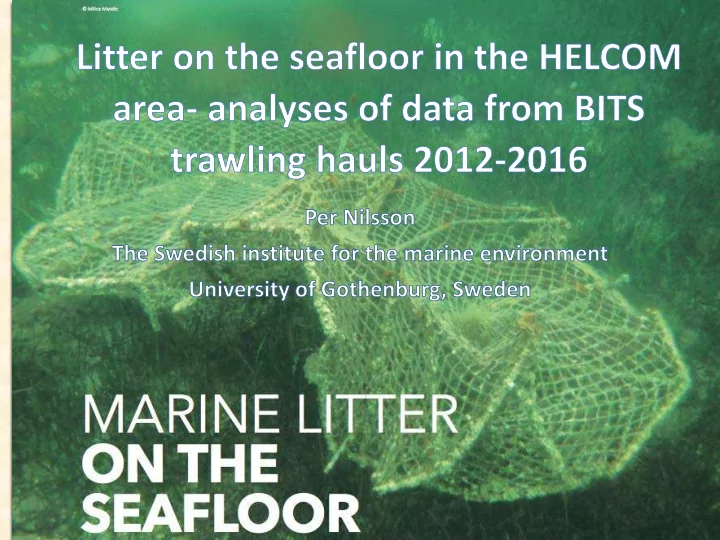

Why monitor litter on the seafloor? • Large area • Area of accumulation? • Previous studies have shown large quantities • Required in the MSFD
How to monitor? Visual counts of litter Collect litter in trawls/dredges using divers or video
The BITS ( Baltic International Trawl Survey ) programme
What is a trawl and how does it capture litter?
Geographical scope Baltic Sub-regions Sediment types
Types of items recorded Several different list used in the Baltic and elsewhere – still under development
Average amount of items in the (surveyed area of) the Baltic Sea NUMBER 58.9± 20.9 items per km 2 (average ± 95% confidence interval) Weight 85.3±65.2 kg per km 2 42 % of the hauls did not contain any litter items
Much or little? • OSPAR area: 13.8-230 items/km 2 depending on region • North Sea: 38 items/km 2 • The Adriatic : 510 ± 517 items/km 2 • Number of hauls containing litter in the OSPAR Area: 59-100%, depending on region Conclusion: Within the same order of magnitude as other Europeans regions Less than the Adriatic and the Bay of Biscayne, more than the North sea
Much or little? Combined area of sub-regions 227000 km 2 ➔ Approximately 13.2 million items ➔ Approximately 19000 tons
Temporal trend? Conclusion: Significant differences among years No temporal trend Confounded with changes in geographical domain?
Different sub-regions OBS! Some extremely high values excluded Conclusion: Significant differences among sub-regions Confounded with temporal trends?
Representativity in sub-regions Area of sub- No of Hauls Sub-basin 2012-2016 Area per haul basin (km 2 ) Eastern Gotland 75093 295 255 Basin Bornholm Basin 42219 648 65 Northern Baltic 39674 9 4408 Proper Western Gotland 27683 59 469 Basin Arkona Basin 17616 315 56 10760 125 86 Great Belt Gdansk Basin 5876 29 203 Bay of 4620 58 80 Mecklenburg 3356 61 55 Kiel Bay Conclusion: Significant differences among sub-regions Influnced by the need of fish stock assessments- not ML
Top X – frequently found items Conclusion: Items from natural materials dominate
Litter in different sediment types Conclusion: Significant differences among sediment types
Representativity in sediment types Sediment Sediment No of Hauls Km 2 per haul type area type 2012-2016 (km 2 ) Non-photic 238000 1066 223 mud and clay Non-photic 50600 341 148 sand Non-photic 41330 28 1476 hard bottom Photic sand 37300 84 444 Photic hard 30970 12 2581 bottom Photic mud 24430 68 359 and clay Conclusion: Best representativity in most common (accumulation) sediment types
Items from natural materials Material Proportion North Sea 2014 (%) by number of items Plastic 30.6 79 Metal 7.5 3 Rubber 2.7 3 Glass and ceramics 8.6 2 Natural 44.6 12 Miscellaneous 6.1 5 Conclusion: Items made from natural materials more common in the Baltic than in other regions
Items from natural materials Conclusion: “Non-natural” weak but significant increase Interpret with caution…
What to do about areas that do not participate in trawl surveys • Accept limited geographical scope? • Extend trawl surveys? • Use other monitoring approaches (e.g. video)?
Summary • Amounts “similar” to other European sea areas • Items made from natural items dominate – different from other European sea areas • No total time trend- but significant increase if natural items are excluded • Monitoring geographical scope changing/improving Analyses should be interpreted with caution • Large areas of the Baltic not yet covered
Recommend
More recommend