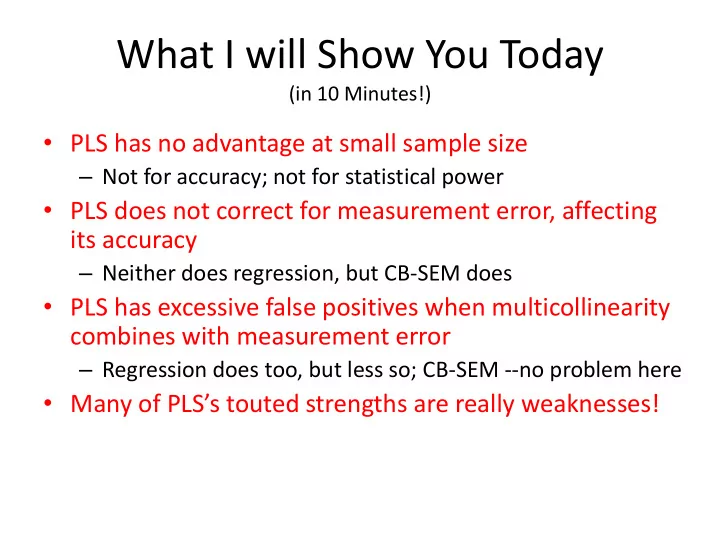

What I will Show You Today (in 10 Minutes!) • PLS has no advantage at small sample size – Not for accuracy; not for statistical power • PLS does not correct for measurement error, affecting its accuracy – Neither does regression, but CB-SEM does • PLS has excessive false positives when multicollinearity combines with measurement error – Regression does too, but less so; CB-SEM --no problem here • Many of PLS’s touted strengths are really weaknesses!
General Model for the Monte Carlo Simulation .70 X1 .76 X2 KSI1 .82 X3 0.0 .70 μ Gamma 1 (.292) X4 .76 X5 KSI2 .82 Gamma 2 .70 Y1 X6 (. 000 ) .76 0.0 Y2 ETA1 .70 X7 .82 Gamma 3 Y3 .76 X8 (. 292 ) KSI3 .82 X9 Gamma 4 (.510) 0.0 .70 X10 .76 X11 KSI4 X12 .82 We can modify: effect size, sample size, reliability of the indicators, amount of correlation between independent constructs
Accuracy and Power for PLS, LISREL and Regression at Different Sample Sizes Medium Effect Size Strong Effect Size 0.050 0.05 0.000 0.00 LISREL LISREL Accuracy -0.050 -0.05 -0.100 -0.10 Regression Regression (Bias) -0.150 -0.15 -0.200 PLS -0.20 PLS -0.250 -0.25 20 40 90 150 200 20 40 90 150 200 Sample Size Sample Size 0.350 0.400 0.350 0.300 LISREL LISREL Standard 0.300 0.250 0.250 0.200 Regression 0.200 Regression Deviations 0.150 0.150 0.100 0.100 PLS PLS 0.050 0.050 0.000 0.000 20 40 90 150 200 20 40 90 150 200 Sample Size Sample Size 1.200 1.20 LISREL 1.000 1.00 LISREL 0.800 0.80 Power 0.600 0.60 Regression Regression 0.400 0.40 0.200 0.20 PLS PLS 0.000 0.00 20 40 90 150 200 20 40 90 150 200 Sample Size Sample Size
Accuracy (Bias) Effect Size = L, M, S; = .74, .84, .91 (Averaging Across N = 90, 150, 200 Sample Sizes) Unadjusted Results 0.30 0.20 0.10 0.00 LISREL -0.10 Regression Bias -0.20 PLS -0.30 L L L M M M S S S Effect, Effect, Effect, Effect, Effect, Effect, Effect, Effect, Effect, a=.74 a=.84 a=.91 a=.74 a=.84 a=.91 a=.74 a=.84 a=.91 Adjusting for Measurement Attenuation (Nunnally & Bernstein) 0.30 0.20 0.10 LISREL Bias 0.00 Reg-Adj -0.10 PLS-Adj -0.20 -0.30 L L L M M M S S S Effect, Effect, Effect, Effect, Effect, Effect, Effect, Effect, Effect, a=.74 a=.84 a=.91 a=.74 a=.84 a=.91 a=.74 a=.84 a=.91 LISREL is quite accurate throughout. Accuracy for PLS and regression depends on reliability. When corrected for measurement error, PLS and regression are quite accurate
False Positives From Measurement Error and Multi-collinearity, = .80 (Based on 500 Samples, 95% confidence interval around 5% is 3.1% to 6.9%) 30% 30% 25% 25% 20% 20% LISREL LISREL 15% 15% Regression Regression 10% 10% PLS PLS 5% 5% 0% 0% 0.0 0.4 0.6 0.8 0.9 0.0 0.4 0.6 0.8 0.9 Correlation between Correlation between independent constructs independent constructs N = 100 N = 300
Touted Strengths of PLS • Better at small sample size • No distribution requirements • Consistency and Consistency at Large • Exploratory versus Theory Testing • Testing with pseudo-F statistics
Recommend
More recommend