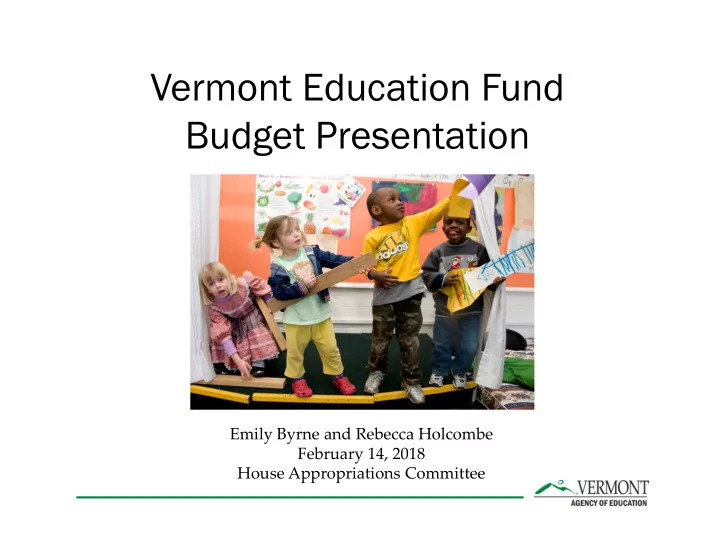

Vermont Education Fund Budget Presentation Emily Byrne and Rebecca Holcombe February 14, 2018 House Appropriations Committee
Agenda Education Fund Highlights • What do we buy with our Education Fund Dollars? • Budget book introduction and walk through appropriations
What do we buy with our Education Dollars? FY2018 Reallocated About 73%: “net education payment” which covers items including (but not Education Fund per ADM limited to): 20,000 most costs of our public schools, • 18,000 tuition payments to other public, 16,000 independent, and out-of-state 14,000 schools tuition payments to Career and 12,000 • Technical Education 10,000 supervisory union costs • 8,000 Local costs related to flexible • 6,000 pathways Prekindergarten 4,000 • 2,000 0
What do we buy with our Education Dollars? FY2018 Reallocated Education Fund per ADM 20,000 18,000 16,000 About 19% is spent on special 14,000 education costs in public and 12,000 independent schools. 10,000 8,000 6,000 4,000 2,000 0
What do we buy with our Education Dollars? FY2018 Reallocated The rest of the $1.6 billion we spend Education Fund per ADM per pupil is spread across a number of 20,000 functions, including: 18,000 subsidies to small schools • 16,000 costs associated with children in • state custody who are placed in 14,000 schools near their foster homes. 12,000 Technical Education support • 10,000 Small school support • 8,000 Flexible pathways • Community HS of Vermont 6,000 • Teacher pensions • 4,000 Other • 2,000 0
Changes in Special Education Practice?
Change in Education Fund Spending Education Expenses Percent (In Millions) Change FY 2015 Actutal 1,514 - FY 2016 Actuals 1,553 2.58% FY 2017 Actuals 1,578 1.61% FY 2018 Estimates 1,621 2.72% FY 2019 Projection 1,681 3.70%
Small School Size: Is it Density? People Per Square Mile 160 140 120 100 80 60 40 20 0 Maine New Hampshire Vermont People Per Square Mile
Or is it a VT preference? New England States: Proportion of schools with 9 irst grade sizes equal to or less than 30 students, or greater than 30 students 80% 70% 60% 50% 40% 30% 20% 10% 0% Maine New Hampshire Vermont Grade size equal to or < 30 Grade size >30
Challenge with Education Funding • The Education pressure: – We have fewer students, – In the same number of schools (public and independent) – With proportionally more overhead to support education on a per pupil basis.
Budget Book • Review – Carryforward – Reversions • Education Fund Appropriations – B.502 through B.511
Recommend
More recommend