valgrind code analyzer Valgrind is another injection-based - PowerPoint PPT Presentation
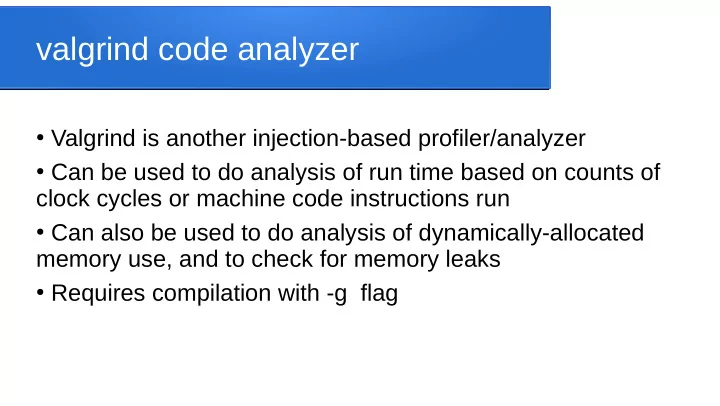
valgrind code analyzer Valgrind is another injection-based profiler/analyzer Can be used to do analysis of run time based on counts of clock cycles or machine code instructions run Can also be used to do analysis of
valgrind code analyzer ● Valgrind is another injection-based profiler/analyzer ● Can be used to do analysis of run time based on counts of clock cycles or machine code instructions run ● Can also be used to do analysis of dynamically-allocated memory use, and to check for memory leaks ● Requires compilation with -g flag
Runtime analysis ● Analyzes time spent in each function by giving a count of number of machine code instructions executed by that function ● Two step process, run program through valgrind, producing data file with integer PID extension, callgrind.out. PID , then run callgrind_annotate on that file, e.g. valgrind –tool=callgrind ./myprogx whatever args callgrind_annotate callgrind.out.237 –inclusive=yes --tree=both
Callgrind/annotate output ● Callgrind_annotate will spit out analysis on a lot of #included functions, so I recommend filtering using grep, e.g. callgrind_annotate ...theoptions... | grep -v build ● For each function it produces several lines of output showing of how many machine code instructions it ran, which functions called it (and how many instructions they ran) and which functions it called (and how many instructions they ran)
Example ● Suppose in file prog.cpp, main calls functions f, g, h, and suppose function g also calls function i ● The lines for g would look something like 6012 < prog.cpp:main() 2064 * prog.cpp: g(int, float) 512 > prog.cpp:i(float) ● The * shows this block is about g, the arrows show whether it was caller or callee, and the instruction counts give you an idea of how long it took each to run
Memory analysis ● Analyzes amount of dynamically allocated memory at each snapshot as a program runs (e.g. may take 10 snapshots) ● Two step process, run program through valgrind, producing data file with integer PID extension, massif.out. PID , then run ms_print on that file, e.g. valgrind –tool=massif ./myprogx whatever args ms_print massif.out.123
Massif/ms_print graph output ● ms_print will show a graph followed by a table, with an extra “peak” analysis somewhere in the table ● The graph shows the amount of dynamically-allocated memory in use as the program runs, taken across a number of snapshots (n) as the program ran ● The table shows, for each of the n snapshots, a breakdown of memory use ● Right after the snapshot where memory use peaked, it will show a breakdown of where the allocated memory came from (which functions/instructions requested how much)
Massif/ms_print table output ● In the table, the first column identifies the current snapshot (e.g. n=0 is the first, n=1 is the second, etc) ● The next column is the time of the snapshot, based on how many (machine code) instructions had run since the program started ● The next column shows the total memory in use at that point ● The next shows the amount of heap (dynamically allocated) memory requested and in use ● The next shows any extra heap space allocated (a request is sometimes allocated a bit more memory than it asked for) ● Finally the size of the stack (this is off by default, so likely shows 0)
Recommend
More recommend
Explore More Topics
Stay informed with curated content and fresh updates.


