Using Linux perf at Netflix Brendan Gregg Senior Performance - PowerPoint PPT Presentation
Using Linux perf at Netflix Brendan Gregg Senior Performance Architect Sep 2017 Case Study: ZFS is ea/ng my CPU Easy to debug using Ne9lix Vector & flame graphs How I expected it to look: Case Study: ZFS is ea/ng my CPU (cont.)
Using Linux perf at Netflix Brendan Gregg Senior Performance Architect Sep 2017
Case Study: ZFS is ea/ng my CPU • Easy to debug using Ne9lix Vector & flame graphs • How I expected it to look:
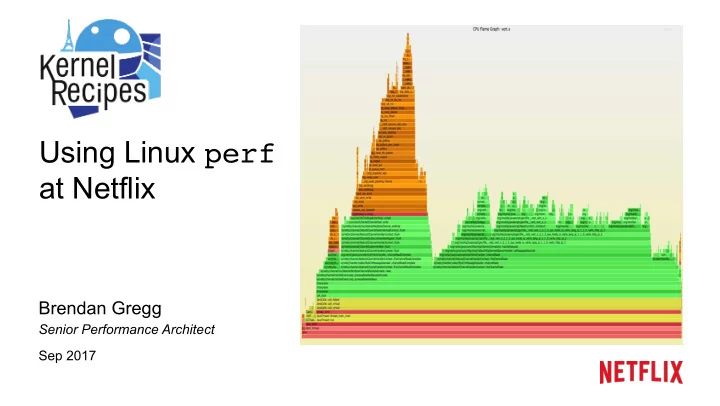
Case Study: ZFS is ea/ng my CPU (cont.) • How it really looked: Applica/on (truncated) 38% kernel /me (why?)
Case Study: ZFS is ea/ng my CPU (cont.) Zoomed: • ZFS ARC (adap/ve replacement cache) reclaim. • But… ZFS is not in use. No pools, datasets, or ARC buffers. • CPU /me is in random entropy, picking which (empty) list to evict. Bug: hUps://github.com/zfsonlinux/zfs/issues/6531
Agenda 1. Why Ne9lix Needs Linux Profiling 2. perf Basics 3. CPU Profiling & Gotchas Stacks (gcc, Java) – Symbols (Node.js, Java) – Guest PMCs – PEBS – Overheads – 4. perf Advanced
1. Why Ne)lix Needs Linux Profiling
Understand CPU usage quickly and completely
Quickly Eg, Ne9lix Vector (self-service UI): Flame Graphs Heat Maps …
Completely CPU Flame Graph Kernel JVM (C) (C++) User Java (C)
Why Linux perf? • Available – Linux, open source • Low overhead – Tunable sampling, ring buffers • Accurate – Applica/on-basic samplers don't know what's really RUNNING; eg, Java and epoll • No blind spots – See user, library, kernel with CPU sampling – With some work: hardirqs & SMI as well • No sample skew – Unlike Java safety point skew
Why is this so important • We typically scale microservices based on %CPU – Small %CPU improvements can mean big $avings • CPU profiling is used by many ac/vi/es – Explaining regressions in new sooware versions – Incident response – 3 rd party sooware evalua/ons – Iden/fy performance tuning targets – Part of CPU workload characteriza/on • perf does lots more, but we spend ~95% of our /me looking at CPU profiles, and 5% on everything else – With new BPF capabili/es (off-CPU analysis), that might go from 95 to 90%
CPU profiling should be easy, but … JIT runtimes no frame pointers no debuginfo stale symbol maps container namespaces …
2. perf Basics
perf (aka "perf_events") • The official Linux profiler – In the linux-tools-common package – Source code & docs in Linux: tools/perf • Supports many profiling/tracing features: – CPU Performance Monitoring Counters (PMCs) – Sta/cally defined tracepoints – User and kernel dynamic tracing – Kernel line and local variable tracing – Efficient in-kernel counts and filters perf_events – Stack tracing, libunwind ponycorn – Code annota/on • Some bugs in the past; has been stable for us
A Mul/tool of Subcommands # perf usage: perf [--version] [--help] [OPTIONS] COMMAND [ARGS] The most commonly used perf commands are: annotate Read perf.data (created by perf record) and display annotated code archive Create archive with object files with build-ids found in perf.data file bench General framework for benchmark suites buildid-cache Manage build-id cache. buildid-list List the buildids in a perf.data file c2c Shared Data C2C/HITM Analyzer. config Get and set variables in a configuration file. data Data file related processing diff Read perf.data files and display the differential profile evlist List the event names in a perf.data file ftrace simple wrapper for kernel's ftrace functionality inject Filter to augment the events stream with additional information kallsyms Searches running kernel for symbols kmem Tool to trace/measure kernel memory properties kvm Tool to trace/measure kvm guest os list List all symbolic event types lock Analyze lock events mem Profile memory accesses record Run a command and record its profile into perf.data report Read perf.data (created by perf record) and display the profile sched Tool to trace/measure scheduler properties (latencies) script Read perf.data (created by perf record) and display trace output stat Run a command and gather performance counter statistics test Runs sanity tests. timechart Tool to visualize total system behavior during a workload top System profiling tool. probe Define new dynamic tracepoints trace strace inspired tool from Linux 4.13 See 'perf help COMMAND' for more information on a specific command.
perf Basic Workflow 1. list -> find events 2. stat -> count them 3. record -> write event data to file 4. report -> browse summary 5. script -> event dump for post processing
Basic Workflow Example # perf list sched:* […] sched:sched_process_exec [Tracepoint event] 1. found an event of interest […] # perf stat -e sched:sched_process_exec -a -- sleep 10 Performance counter stats for 'system wide': 2. 19 per 10 sec is a very low 19 sched:sched_process_exec rate, so safe to record 10.001327817 seconds time elapsed # perf record -e sched:sched_process_exec -a -g -- sleep 10 [ perf record: Woken up 1 times to write data ] 3. 21 samples captured [ perf record: Captured and wrote 0.212 MB perf.data (21 samples) ] # perf report -n --stdio # Children Self Samples Trace output # ........ ........ ............ ................................................. 4.76% 4.76% 1 filename=/bin/bash pid=7732 old_pid=7732 | 4. summary style may be ---_start return_from_SYSCALL_64 sufficient, or, do_syscall_64 sys_execve do_execveat_common.isra.35 5. script output in /me order […] # perf script sleep 7729 [003] 632804.699184: sched:sched_process_exec: filename=/bin/sleep pid=7729 old_pid=7729 44b97e do_execveat_common.isra.35 (/lib/modules/4.13.0-rc1-virtual/build/vmlinux) 44bc01 sys_execve (/lib/modules/4.13.0-rc1-virtual/build/vmlinux) 203acb do_syscall_64 (/lib/modules/4.13.0-rc1-virtual/build/vmlinux) acd02b return_from_SYSCALL_64 (/lib/modules/4.13.0-rc1-virtual/build/vmlinux) c30 _start (/lib/x86_64-linux-gnu/ld-2.23.so) […]
perf stat/record Format • These have three main parts: ac/on, event, scope. • e.g., profiling on-CPU stack traces: AcCon : record stack traces perf record -F 99 - a -g -- sleep 10 Scope : all CPUs Event : 99 Hertz Note: sleep 10 is a dummy command to set the dura/on
perf Ac/ons • Count events (perf stat …) – Uses an efficient in-kernel counter, and prints the results • Sample events (perf record …) – Records details of every event to a dump file (perf.data) • Timestamp, CPU, PID, instruc/on pointer, … – This incurs higher overhead, rela/ve to the rate of events – Include the call graph (stack trace) using -g • Other ac/ons include: – List events (perf list) – Report from a perf.data file (perf report) – Dump a perf.data file as text (perf script) – top style profiling (perf top)
perf Events • Custom /mers – e.g., 99 Hertz (samples per second) • Hardware events – CPU Performance Monitoring Counters (PMCs) • Tracepoints – Sta/cally defined in sooware • Dynamic tracing – Created using uprobes (user) or kprobes (kernel) – Can do kernel line tracing with local variables (needs kernel debuginfo)
perf Events: Map
perf Events: List # perf list List of pre-defined events (to be used in -e): cpu-cycles OR cycles [Hardware event] instructions [Hardware event] cache-references [Hardware event] cache-misses [Hardware event] branch-instructions OR branches [Hardware event] branch-misses [Hardware event] bus-cycles [Hardware event] stalled-cycles-frontend OR idle-cycles-frontend [Hardware event] stalled-cycles-backend OR idle-cycles-backend [Hardware event] […] cpu-clock [Software event] task-clock [Software event] page-faults OR faults [Software event] context-switches OR cs [Software event] cpu-migrations OR migrations [Software event] […] L1-dcache-loads [Hardware cache event] L1-dcache-load-misses [Hardware cache event] L1-dcache-stores [Hardware cache event] […] skb:kfree_skb [Tracepoint event] skb:consume_skb [Tracepoint event] skb:skb_copy_datagram_iovec [Tracepoint event] net:net_dev_xmit [Tracepoint event] net:net_dev_queue [Tracepoint event] net:netif_receive_skb [Tracepoint event] net:netif_rx [Tracepoint event] […]
perf Scope • System-wide: all CPUs ( -a ) • Target PID ( -p PID ) • Target command ( … ) • Specific CPUs ( -c … ) • User-level only ( <event>:u ) • Kernel-level only ( <event>:k ) • A custom filter to match variables ( --filter … ) • This cgroup (container) only ( --cgroup …)
Recommend
More recommend
Explore More Topics
Stay informed with curated content and fresh updates.


