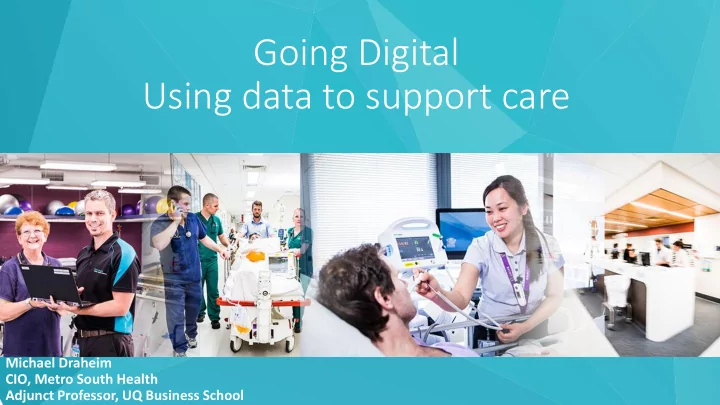

Going Digital Using data to support care Michael Draheim CIO, Metro South Health Adjunct Professor, UQ Business School
Who are we - Prin incess Ale lexandra Hospit ital billion Metro South Health
What have we Im Imple lemented • Structured clinical notes • Emergency Department • Surgery, Theatres & Anaesthetics • Integrated inpatient clinical information • Pathology and Radiology orders and results • Scheduling – Outpatients and Elective Surgery • Device integration & Closed loop observations • Managing deteriorating patients workflow • Positive person identification • CPOE & Medication Management – Closed loop • Clinical trials • Reporting, Analytics and Data Warehouse • 7/24 (downtime) Metro South Health
Make the Case - Why Dig igit ital • 10% of patients with a drug allergy are prescribed that drug during a hospital admission • There are more people in hospital from preventable medication incidents than from asthma and breast cancer combined • 30% of all radiology and pathology investigations are inappropriate or unnecessary 1 • Most Australian doctors can’t order a chest X-Ray electronically. 1.Harvard Medical School, PRESCOTT, 2013 Metro South Health
Be Cle lear why y • Text Metro South Health
The Data Landscape in in Healt lthcare • Traditionally focus on data exercises: • Performance based • Manually codified • Output/Outcome driven • Resource intensive • Silos of data • The future • Real time • Integrated care • Data driven • Consumer centric
Princess Alexandra Hospital - Year 1 Digital Hospital Experience Activity Reducing care variation Performance benefits Go Live Variation Hospital standardised mortality 80+ Power Plans introduced 40+ Order sets activated Rapid response 45% Cardiac arrests 15 less than predicted (2016 cf 2015) Emerg re-admits 4% Falls with injury 12% (2016 cf 2015) Failure to rescue Post Go Live Power Plans ordered 12,220 (May 2017) QWAU 10% (April 2017 YTD) Unique patients 80,518 (May 2017) Seps 7.2% (April 2017 YTD) Total measured 57.7M (May 2017) ALOS 5% (April 2017 YTD) transactions
Data supportin ing quali lity care
Metro South Health
MSH Dig igit ital Governance Model Metro South Digital Executive Committee Strategic Digital Support and Adoption Services Adoption/ Digital Clinical Improvement Digital Hospital Benefits Digital Technical Committee Digital Data Governance Group Support Prioritisation Group (DCIP) Committee Tactical Training MSH Medical Digital Workflow MSH Nursing Digital Workflow Logan & BDH Digital Hospital PAH Digital Hospital Committee Committee Committee Committee BCP MSH Allied Health Digital Workflow MSH Admin Digital Workflow Redland & Wynnum Digital Hospital QEII Digital Hospital Committee Committee Committee Committee System Enhancement Operational
Success Story – Clinical Deterioration • Worked with multi-disciplinary Clinical & IT team to identify core attributes in visualising current and trended data associated to deterioration of patients within the confine of their hospital stay. • Integrated multiple datasets from silo systems into MSH Warehouse – ieMR, HBCIS (PAS), Rapid Response Team Local Database • Data visualised via Interactive Dashboards – giving ability for clinical staff to review: – When and where deterioration is occurring within the hospital – Patient’s ‘at Risk’ of deteriorating to point of requiring Rapid Response – Clinical Outcomes attached to patients who have deteriorated
Clinical Deterioration Dashboard
Red & Yellow Alerts
Success Story – Medications Clinical Monitoring • Worked with key senior clinical staff to develop visualisation of key medication ordering/administration data to allow safety and quality monitoring – especially for ‘risky’ medications/workflows (i.e. Insulin & Heparin) • Results – Live clinical safety & quality monitoring of medication orders & administration – Ability to instantly identify ‘risky’ patients (i.e. BGL >16, High/Low APTT etc.) – Ability to intervene before administration of medications where unwarranted care deviation – Identification of consistent data trends to help assist in optimising functional design of electronic prescribing within ieMR
Digital Diabetes Dashboard
Success Story – Pathology & Radiology Endorsement • Interactive dashboards providing near real time visibility Results being ordered, and consequently endorsed within the ieMR Results – Ability to filter by location, clinician designation, encounter type, Pathology Catalogue type, date etc. – Views of the data can be changed to display by Unit, Treating Clinician or Ordering User – Clinicians & Executives are able to query the dashboard down to staff/patient level, and if desired, expose result specific data attached to each event • Results – Transparency across organisation as to compliance with viewing/endorsing results – Ability for Clinical Leadership to follow-up with services/staff who require more attention/support
Pathology & Radiology Results Dashboard
Key Messages • No matter which tool you use, the output will only be as good as the data that is entered into the source system • Implementation of a digital system causes disruption to the organisation • focus and support needs to be provided to clinicians to ensure quality of data inputted into the system supports immediate patient care, but also analytic exercises • Start small and grow organically • Multidisciplinary approach to Health Analytics is critical • IT staff who can understand and operate in clinical environment, • Clinical staff who can understand and operate in IT environment
Thank you! Th Metro South Health
Recommend
More recommend