Unsupervised learning: basics CLUS TERIN G METH ODS W ITH S CIP Y - PowerPoint PPT Presentation
Unsupervised learning: basics CLUS TERIN G METH ODS W ITH S CIP Y Shaumik Daityari Business Analyst Everyday example: Google news How does Google News classify articles? Unsupervised Learning Algorithm: Clustering Match frequent terms in
Unsupervised learning: basics CLUS TERIN G METH ODS W ITH S CIP Y Shaumik Daityari Business Analyst
Everyday example: Google news How does Google News classify articles? Unsupervised Learning Algorithm: Clustering Match frequent terms in articles to �nd similarity CLUSTERING METHODS WITH SCIPY
Labeled and unlabeled data Data with no labels Point 1: (1, 2) Point 2: (2, 2) Point 3: (3, 1) Data with labels Point 1: (1, 2), Label: Danger Zone Point 2: (2, 2), Label: Normal Zone Point 3: (3, 1), Label: Normal Zone CLUSTERING METHODS WITH SCIPY
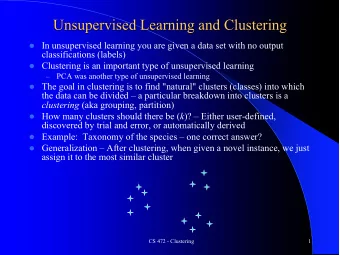
What is unsupervised learning? A group of machine learning algorithms that �nd patterns in data Data for algorithms has not been labeled, classi�ed or characterized The objective of the algorithm is to interpret any structure in the data Common unsupervised learning algorithms: clustering, neural networks, anomaly detection CLUSTERING METHODS WITH SCIPY
What is clustering? The process of grouping items with similar characteristics Items in groups similar to each other than in other groups Example: distance between points on a 2D plane CLUSTERING METHODS WITH SCIPY
Plotting data for clustering - Pokemon sightings from matplotlib import pyplot as plt x_coordinates = [80, 93, 86, 98, 86, 9, 15, 3, 10, 20, 44, 56, 49, 62, 44] y_coordinates = [87, 96, 95, 92, 92, 57, 49, 47, 59, 55, 25, 2, 10, 24, 10] plt.scatter(x_coordinates, y_coordinates) plt.show() CLUSTERING METHODS WITH SCIPY
CLUSTERING METHODS WITH SCIPY
CLUSTERING METHODS WITH SCIPY
Up next - some practice CLUS TERIN G METH ODS W ITH S CIP Y
Basics of cluster analysis CLUS TERIN G METH ODS W ITH S CIP Y Shaumik Daityari Business Analyst
What is a cluster? A group of items with similar characteristics Google News: articles where similar words and word associations appear together Customer Segments CLUSTERING METHODS WITH SCIPY
Clustering algorithms Hierarchical clustering K means clustering Other clustering algorithms: DBSCAN, Gaussian Methods CLUSTERING METHODS WITH SCIPY
CLUSTERING METHODS WITH SCIPY
CLUSTERING METHODS WITH SCIPY
CLUSTERING METHODS WITH SCIPY
CLUSTERING METHODS WITH SCIPY
CLUSTERING METHODS WITH SCIPY
Hierarchical clustering in SciPy from scipy.cluster.hierarchy import linkage, fcluster from matplotlib import pyplot as plt import seaborn as sns, pandas as pd x_coordinates = [80.1, 93.1, 86.6, 98.5, 86.4, 9.5, 15.2, 3.4, 10.4, 20.3, 44.2, 56.8, 49.2, 62.5, 44.0] y_coordinates = [87.2, 96.1, 95.6, 92.4, 92.4, 57.7, 49.4, 47.3, 59.1, 55.5, 25.6, 2.1, 10.9, 24.1, 10.3] df = pd.DataFrame({'x_coordinate': x_coordinates, 'y_coordinate': y_coordinates}) Z = linkage(df, 'ward') df['cluster_labels'] = fcluster(Z, 3, criterion='maxclust') sns.scatterplot(x='x_coordinate', y='y_coordinate', hue='cluster_labels', data = df) plt.show() CLUSTERING METHODS WITH SCIPY
CLUSTERING METHODS WITH SCIPY
CLUSTERING METHODS WITH SCIPY
CLUSTERING METHODS WITH SCIPY
CLUSTERING METHODS WITH SCIPY
CLUSTERING METHODS WITH SCIPY
K-means clustering in SciPy from scipy.cluster.vq import kmeans, vq from matplotlib import pyplot as plt import seaborn as sns, pandas as pd import random random.seed((1000,2000)) x_coordinates = [80.1, 93.1, 86.6, 98.5, 86.4, 9.5, 15.2, 3.4, 10.4, 20.3, 44.2, 56.8, 49.2, 62.5, 44.0] y_coordinates = [87.2, 96.1, 95.6, 92.4, 92.4, 57.7, 49.4, 47.3, 59.1, 55.5, 25.6, 2.1, 10.9, 24.1, 10.3] df = pd.DataFrame({'x_coordinate': x_coordinates, 'y_coordinate': y_coordinates}) centroids,_ = kmeans(df, 3) df['cluster_labels'], _ = vq(df, centroids) sns.scatterplot(x='x_coordinate', y='y_coordinate', hue='cluster_labels', data = df) plt.show() CLUSTERING METHODS WITH SCIPY
CLUSTERING METHODS WITH SCIPY
Next up: hands-on exercises CLUS TERIN G METH ODS W ITH S CIP Y
Data preparation for cluster analysis CLUS TERIN G METH ODS W ITH S CIP Y Shaumik Daityari Business Analyst
Why do we need to prepare data for clustering? Variables have incomparable units (product dimensions in cm, price in $) Variables with same units have vastly different scales and variances (expenditures on cereals, travel) Data in raw form may lead to bias in clustering Clusters may be heavily dependent on one variable Solution: normalization of individual variables CLUSTERING METHODS WITH SCIPY
Normalization of data Normalization: process of rescaling data to a standard deviation of 1 x_new = x / std_dev(x) from scipy.cluster.vq import whiten data = [5, 1, 3, 3, 2, 3, 3, 8, 1, 2, 2, 3, 5] scaled_data = whiten(data) print(scaled_data) [2.73, 0.55, 1.64, 1.64, 1.09, 1.64, 1.64, 4.36, 0.55, 1.09, 1.09, 1.64, 2.73] CLUSTERING METHODS WITH SCIPY
Illustration: normalization of data # Import plotting library from matplotlib import pyplot as plt # Initialize original, scaled data plt.plot(data, label="original") plt.plot(scaled_data, label="scaled") # Show legend and display plot plt.legend() plt.show() CLUSTERING METHODS WITH SCIPY
Next up: some DIY exercises CLUS TERIN G METH ODS W ITH S CIP Y
Recommend


More recommend
Explore More Topics
Stay informed with curated content and fresh updates.