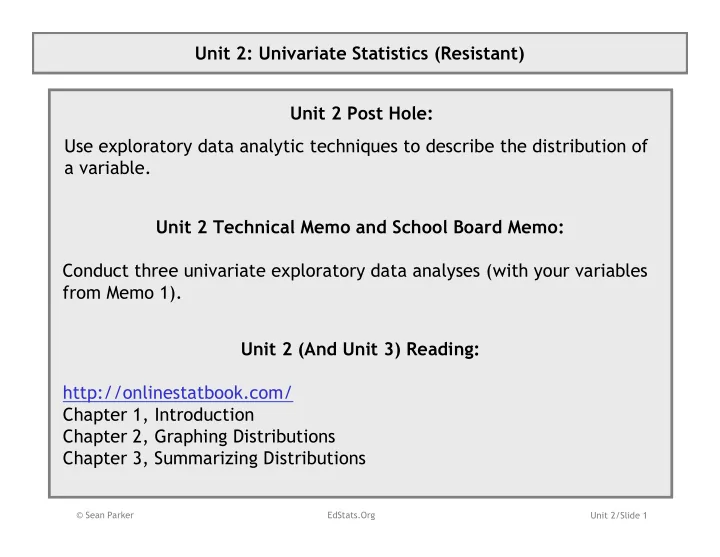

Unit�2:�Univariate Statistics�(Resistant) Unit�2�Post�Hole: ����������������������������������������������������������������������� � ��!�������� Unit�2�Technical�Memo�and�School�Board�Memo: "����������������!������ ��������������������������#$���������!��������� ��%�&�%���'� Unit�2�(And�Unit�3)�Reading: ����(�������������������%� "��������)�*����������� "��������)�+��������,������������ "�������-)���%%���.����,������������ � ��������������������������������������������������������������� ����������� ��������������
Unit�2:�Technical�Memo�and�School�Board�Memo Work�Products�(Part�I�of�II): I. Technical�Memo:�Have�one�section�per�biviariate analysis.�For�each�section,�follow�this�outline.�(2�Sections) A. Introduction i. State�a�theory�(or�perhaps�hunch)�for�the�relationship—think�causally,��be�creative.�(1�Sentence) ii. State�a�research�question�for�each�theory�(or�hunch)—think�correlationally,�be�formal.�Now�that�you�know� the�statistical�machinery�that�justifies�an�inference�from�a�sample�to�a�population,�begin�each�research� question,�“In�the�population,…” (1�Sentence) iii. List�the�two�variables,�and�label�them�“outcome” and�“predictor,” respectively. iv. Include�your�theoretical�model. B. Univariate Statistics.�Describe�your�variables,�using�descriptive�statistics.�What�do�they�represent�or�measure?� i. Describe�the�data�set.�(1�Sentence) ii. Describe�your�variables.�(1�Short�Paragraph�Each) a. Define�the�variable�(parenthetically�noting�the�mean�and�s.d.�as�descriptive�statistics). b. Interpret�the�mean�and�standard�deviation�in�such�a�way�that�your�audience�begins�to�form�a�picture� of�the�way�the�world�is.�Never�lose�sight�of�the�substantive�meaning�of�the�numbers. c. Polish�off�the�interpretation�by�discussing�whether�the�mean�and standard�deviation�can�be� misleading,�referencing�the�median,�outliers�and/or�skew�as�appropriate.� C. Correlations.�Provide�an�overview�of�the�relationships�between�your�variables�using�descriptive�statistics. i. Interpret�all�the�correlations�with�your�outcome�variable.�Compare�and�contrast�the�correlations�in�order�to� ground�your�analysis�in�substance.�(1�Paragraph) ii. Interpret�the�correlations�among�your�predictors.�Discuss�the�implications�for�your�theory.�As�much�as� possible,�tell�a�coherent�story.�(1�Paragraph) iii. As�you�narrate,�note�any�concerns�regarding�assumptions�(e.g.,�outliers�or�non9linearity),�and,�if�a� correlation�is�uninterpretable because�of�an�assumption�violation,�then�do�not�interpret�it. � ��������������������������������������������������������������� ����������� ��������������
Unit�2:�Technical�Memo�and�School�Board�Memo Work�Products�(Part�II�of�II): I. Technical�Memo�(continued) D. Regression�Analysis.�Answer�your�research�question�using�inferential�statistics.��(1�Paragraph) i. Include�your�fitted�model. Use�the�R 2 statistic�to�convey�the�goodness�of�fit�for�the�model�(i.e.,�strength). ii. iii. To�determine�statistical�significance,�test�the�null�hypothesis�that�the�magnitude�in�the�population�is�zero,� reject�(or�not)�the�null�hypothesis,�and�draw�a�conclusion�(or�not)�from�the�sample�to�the�population. iv. Describe�the�direction�and�magnitude�of�the�relationship�in�your sample,�preferably�with�illustrative� examples.�Draw�out�the�substance�of�your�findings�through�your�narrative. v. Use�confidence�intervals�to�describe�the�precision�of�your�magnitude�estimates�so�that�you�can�discuss�the� magnitude�in�the�population. vi. If�simple�linear�regression�is�inappropriate,�then�say�so,�briefly�explain�why,�and�forego�any�misleading� analysis. X. Exploratory�Data�Analysis.�Explore�your�data�using�outlier�resistant�statistics. i. For��each�variable,�use�a�coherent�narrative�to��convey�the�results�of�your�exploratory�univariate analysis�of� the�data.�Don’t�lose�sight�of�the�substantive�meaning�of�the�numbers.�(1�Paragraph�Each) ii. For�the�relationship�between�your�outcome�and�predictor,�use�a�coherent�narrative�to�convey�the�results�of� your�exploratory�bivariate analysis�of�the�data.�(1�Paragraph) II. School�Board�Memo:�Concisely,�precisely�and�plainly�convey�your�key�findings�to�a�lay�audience.�Note�that,�whereas�you� are�building�on�the�technical�memo�for�most�of�the�semester,�your�school�board�memo�is�fresh�each�week.�(Max�200� Words)� III. Memo�Metacognitive � ��������������������������������������������������������������� ����������� �������������-
Recommend
More recommend