Thrive 2050: A Framework for Thinking About the Future 1 - PowerPoint PPT Presentation
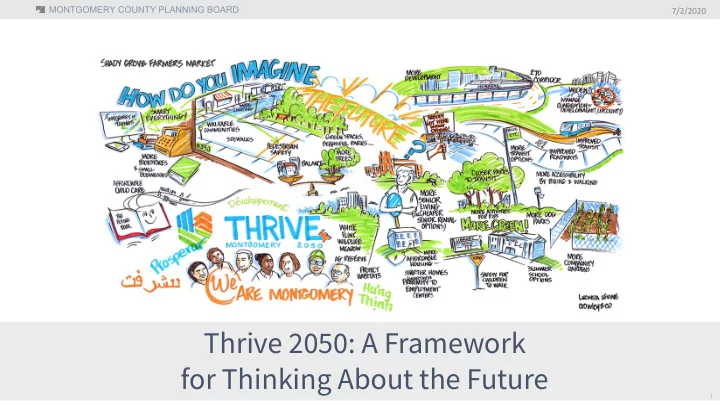
MONTGOMERY COUNTY PLANNING BOARD 7/2/2020 Thrive 2050: A Framework for Thinking About the Future 1 MONTGOMERY COUNTY PLANNING BOARD What is Thrive Montgomery 2050? What can it do? Thrive Montgomery 2050 is Montgomery Countys General
MONTGOMERY COUNTY PLANNING BOARD 7/2/2020 Thrive 2050: A Framework for Thinking About the Future 1
MONTGOMERY COUNTY PLANNING BOARD What is Thrive Montgomery 2050? What can it do? • Thrive Montgomery 2050 is Montgomery County’s General Plan. • A General Plan is a policy document that guides, over multiple decades, how a jurisdiction will develop and change over time and respond to future opportunities and challenges . • Unlike a sector plan, master plan or functional plan, a General Plan does not provide specific land use guidance to address short-term issues in targeted geographic areas. It does not change zoning ; and it addresses multiple topic areas, rather than just one. • Thrive 2050 will have an implementation chapter that will discuss tools for implementing recommendations in the plan • Additional land use, facility, infrastructure plans & studies • Capital improvements process • Zoning & other regulatory tools 2
MONTGOMERY COUNTY PLANNING BOARD What does Thrive 2050 propose for single-family zoning? • Thrive Montgomery 2050 recommends modest increases of density in areas currently zoned exclusively for single-family housing near high-capacity transit to provide housing types such as duplexes, triplexes and quadplexes for varying housing needs and affordability levels. • This is an important step in how the county begins to address past inequities and constraints on housing choice, while also creating more housing that is affordable and attainable to people of all income levels. • Full list of recommendations available on thrivemontgomery.com 3
MONTGOMERY COUNTY PLANNING BOARD Montgomery County expected to add over 60,000 households by 2040 • Between 2020 and 2040, Montgomery County is expected to need to add 63,031 new households, both working and non- working households, specifically new residents who are seniors or persons with disabilities. • Over the 2020 to 2040 period, forecast assumptions suggest that Montgomery County will need to add the following types of housing units to accommodate the forecasted households: Housing Forecasts by Type and Tenure, 2020-2040 (%) 60.00% 54.80% 50.00% 40.00% 27.40% 30.00% 20.00% 13.50% 10.00% 4.40% 0.00% Single-Family Owner Multifamily Owner Single-Family Renter Multifamily Renter *Multifamily includes townhomes, duplexes, apartments and condominiums. 4 Source: LSA, U.S. Census Bureau
MONTGOMERY COUNTY PLANNING BOARD Montgomery County has become more diverse in the last decade • On net, the number of white and black households have fallen, while Asian, Hispanic, and other households have grown rapidly. Change in Number of Households by Race of Householder, 2010 - 2018 9,000 5,000 1,000 -3,000 -7,000 -11,000 -15,000 White Alone Black Alone Asian Alone Hispanic or Latino Other Race Alone Two or More Races Alone Percent -7% -2% 23% 26% 36% 66% Change 5 Source: 2010, 2018 ACS 1-Year Estimates
MONTGOMERY COUNTY PLANNING BOARD The county will continue to be a regional driver of population growth in the 55+ age group, capturing the highest share (a fifth) of regional growth. • Due to the large existing 55+ population, the county is not adding 55+ households the most rapidly. • The only proportion of population expected to grow by 2040 is 55+ households Shifts in the 55+ Age Group, 2010-2018 ranked by largest to smallest % change in population Percent Change Share of Regional Change in in Population Population Loudoun County 69% 11% 47% 10% Prince William County 41% 4% Charles County Frederick County 36% 6% 31% 18% Prince George's County 27% 2% Alexandria city Montgomery County 26% 19% 25% 19% Fairfax County 23% 3% Arlington County DC 19% 8% 6 Source: 2010, 2018 ACS 1-Year Estimates
MONTGOMERY COUNTY PLANNING BOARD “Barbell” growth in low- and high-income households • Since 2010, household growth in Montgomery County has been concentrated in households the lowest and highest end of the income distribution. • These trends could be due to various factors, including existing households increasing their income or lower income households moving to the county. Change in Number of Households by Income Bracket, 2010-2018 +5.8K HHs Earning Less than $25K 6,000 +4K HHs 5,000 Earning $125K+ 4,000 3,000 2,000 1,000 0 Less than $25K $25K to $49,999 $50K to $74,999 $75K to $99,999 $100K to $124,999 $125K or more *2018 inflation-adjusted dollars $108,000 Median HH Income 7 Source: 2010, 2018 ACS 5-Year Estimates
MONTGOMERY COUNTY PLANNING BOARD We expect this “barbell income growth” to continue - county is expected to gain low- and high-income households • Based on the wages of new jobs and the number of workers per household, along with the incomes of non-working households, it is expected that the greatest shares of new households over the 2020 to 2040 period will have incomes between $25,000 and $49,999 (26.6%) and $125,000 and over (23.9%). Household Forecasts by Household Income, 2020-2040 18,000 30% 27% 16,000 24% 25% 14,000 12,000 20% 17% 16% 10,000 15% 8,000 9% 6,000 10% 7% 4,000 5% 2,000 4,399 16,739 10,324 10,939 5,588 15,042 0 0% Less than $25,000 $25,000 to $49,999 $50,000 to $74,999 $75,000 to $99,999 $100,000 to $124,999 $125,000 and higher Households Percent of Total 8 Source: LSA, Woods & Poole, U.S. Census Bureau, U.S. Bureau of Labor Statistics
MONTGOMERY COUNTY PLANNING BOARD 1 in 2 new households in Montgomery County are low-income (<$50K) Since 2010, about half of all new households earn less than $50K annually. While in 2018, households earning less than $50K comprised of just less than a third of total households, this group has been growing the most rapidly over the past decade. This indicates that while high income households remain the largest group in, there is an increasing need for affordable housing to accompany the County’s shifting demographics. Net New Households, 2000 - 2018 100% 90% 80% 70% 60% 50% 40% 30% 20% 10% 0% 2010 - 2018 Distribution 2018 Distribution Less than $25K $25K to $49,999 $50K to $74,999 $75K to $99,999 $100K to $124,999 $125K or more 9 Source: 2010, 2018 ACS 5-Year Estimates *2018 inflation-adjusted dollars
MONTGOMERY COUNTY PLANNING BOARD Montgomery County capturing an outsized share of low-income (<$50K) HHs • Only large county in region for which this is true—Fairfax and Prince George’s are adding low-income households at a lower proportion to their existing shares. D.C. is actively losing low-income residents—likely displacing them into these adjacent counties. Share of Low-Income Households in Share of Net New Low-Income Households Share of Total Households in the Region, 2018 the Region, 2018 in the Region, 2010-2018 18% 17% 20% Montgomery County Montgomery County Montgomery County Rest of Region: Rest of Region: Rest of Region: Fairfax County 19% Fairfax County 14% Fairfax County 15% Prince George's County 15% Prince George's County 18% Prince George's County 14% District of Columbia 14% District of Columbia 21% District of Columbia -8% Prince William County 7% Prince William County 6% Prince William County 14% Loudoun County 6% Loudoun County 4% Loudoun County 12% Howard County 4% Howard County 8% Howard County 5% Arlington County 5% Arlington County 4% Arlington County 3% Frederick County 4% Frederick County 5% Frederick County 10% Alexandria city County 3% Alexandria city County 4% Alexandria city County 4% Charles County 3% Charles County 9% Charles County 3% Lower Greater Share Share *2018 inflation-adjusted dollars 10 Source: 2010, 2018 ACS 5-Year Estimates
MONTGOMERY COUNTY PLANNING BOARD Limited new construction creates supply constraints Montgomery County Building Permits 12,000 1,200,000 10,000 1,000,000 8,000 800,000 Average 80 – 89: 7,100 6,000 600,000 Average 90 – 99: 3,900 4,000 400,000 Average 00 – 09: 3,600 Average 10 – 19: 2,700 2,000 200,000 0 - Total Building Permits Forecasted Additonal Needed Population Population Forecast 11 Source: 1960-2010 US Census, 2016 American Community Survey, 1-year estimate, Census Bureau Building Permits
MONTGOMERY COUNTY PLANNING BOARD Non-family households (other non-family and non-family, householder living alone) are the most common household type since 2000 Household Family Types 1960-2018 1% 2% 6% 6% 7% 6% 8% 7% 14% Other Non-Family 6% 21% 25% 4% 22% 24% 25% 4% Non-Family, householder living alone 27% 5% 7% 8% 7% 6% 8% 29% 6% 7% 7% 8% Other Family 30% 30% 27% 30% Single Parent, children <18 28% 60% 47% Married Couple, no children <18 32% 28% 28% 26% 26% Married Couple, children < 18 1960 1970 1980 1990 2000 2010 2018 12 Source: 1960-2010 US Census, 2018 American Community Survey, 1-year estimate
MONTGOMERY COUNTY PLANNING BOARD Homeownership one of the biggest ways to build wealth, but owning unaffordable to median HH $150,000 10.0% Homeownership Affordability, 2010 - 2018 $140,000 9.0% $125,621 $130,000 8.0% Household Income Required to Afford the Median Home Value $120,000 7.0% $108,188 $110,000 6.0% Actual Median Household income $100,000 5.0% $90,000 4.0% $80,000 30-Year Fixed Rate Mortgage 3.0% $70,000 2.0% $60,000 1.0% $50,000 0.0% 2010 2011 2012 2013 2014 2015 2016 2017 2018 *2018 inflation-adjusted dollars 13 Source: Montgomery County Housing Needs Assessment, Zillow, Federal Reserve Economic Data
Recommend


More recommend
Explore More Topics
Stay informed with curated content and fresh updates.