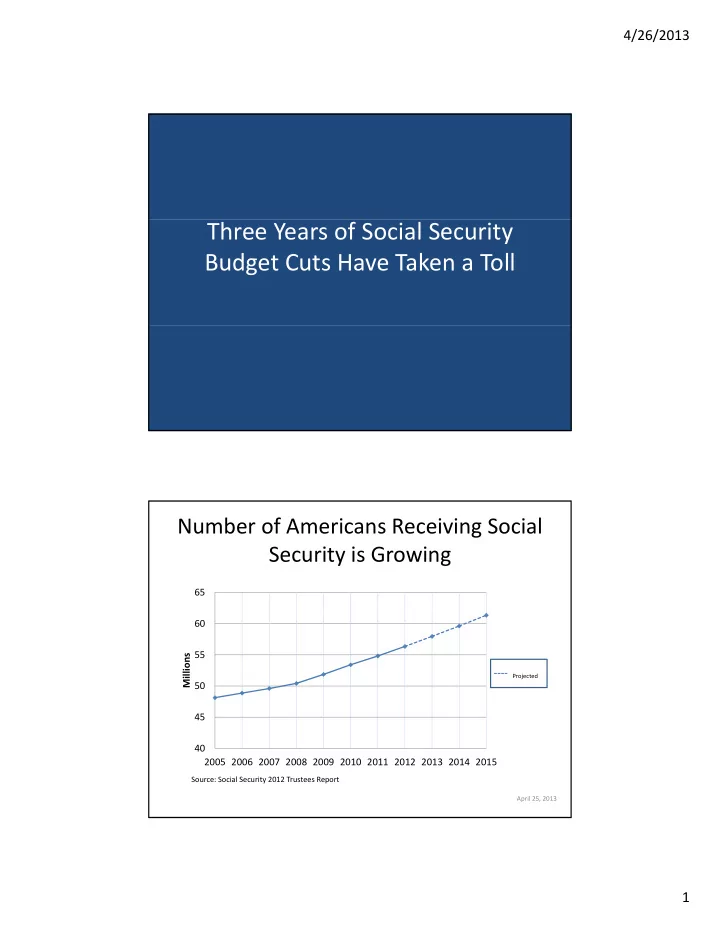
4/26/2013 Three Years of Social Security Budget Cuts Have Taken a Toll Number of Americans Receiving Social Security is Growing 65 60 55 Millions Projected 50 45 40 2005 2006 2007 2008 2009 2010 2011 2012 2013 2014 2015 Source: Social Security 2012 Trustees Report April 25, 2013 1
4/26/2013 Social Security’s Budget is Smaller Now Than It Was 3 Years Ago Social Security’s Total Budget for Administrative Expenses (2010 ‐ 2013) $12 5 $12.5 $12.0 $11.5 $11.0 Billions $10.5 $10.0 $9.5 $9.0 $8.5 $8.0 2010 2011 2012 2013 Source: Social Security Administration April 25, 2013 Budget Cuts Have Reduced Staffing at SSA Field Offices By More than 10% Nationwide since 2010 A typical Social Security office assists about 1,200 Americans a week, 700 in person and 500 by phone. 0% to 4.9% staff loss 5% to 9 9% staff loss 5% to 9.9% staff loss 10% to 14.9% staff loss 15% to 19.9% staff loss 20% staff loss or more Source: Social Security Administration data (HRODS) April 25, 2013 2
4/26/2013 Visitor Caseloads Have Increased, and So Have Waiting Times for Service Percentage Increase in Social Security Office Visitors Per SSA Employee, 2011 ‐ 2013 SSA Employee, 2011 2013 9.2% Average waiting times for service, 6.7% which used to 5.6% range from 0 to 43 minutes for walk ‐ ins, now range now range from 0 to 71 minutes. 2011 2012 2013 Source: Social Security Administration administrative data April 25, 2013 Americans Must Wait Twice As Long for Phone Help Average Time on Hold For SSA 800 ‐ Number Callers 8 8 7 6 Projected based on 5 Minutes enacted budget 4 level, not 3 including sequester 2 2 1 0 2009 2010 2011 2012 2013 Source: Social Security Performance and Accountability Report April 25, 2013 3
4/26/2013 Disability Wait Times Again on the Rise Improvements Gained From Additional Investments are Being Lost Average Waiting Time for Social Security Appeals Hearing, FY 2010 ‐ February 2013 550 550 500 450 Days 400 350 350 300 Oct ‐ 09 Dec ‐ 09 Feb ‐ 10 Apr ‐ 10 Jun ‐ 10 Aug ‐ 10 Oct ‐ 10 Dec ‐ 10 Feb ‐ 11 Apr ‐ 11 Jun ‐ 11 Aug ‐ 11 Oct ‐ 11 Dec ‐ 11 Feb ‐ 12 Apr ‐ 12 Jun ‐ 12 Aug ‐ 12 Oct ‐ 12 Dec ‐ 12 Feb ‐ 13 Source: Social Security Administration April 25, 2013 Backlog of Unprocessed Work is Growing Amount of un ‐ done work to ensure current Social Examples of backlogged work : Security recipients receive timely, accurate payments • Address changes • Payment information P t i f ti 9,000 changes s – number of workers needed to 8,000 • Recoupment of nate backlog within one year 7,000 overpayments • Payment of 6,000 underpayments 5,000 • Application of work 4,000 incentives for disabled beneficiaries 3,000 • Background checks on Background checks on Workyears elimin 2,000 “representative 1,000 payees,” who receive benefits on behalf of 0 mentally disabled and 2010 2011 2012 other vulnerable beneficiaries Source: Social Security Administration Justification of Estimates for Appropriations Committees, 2010 ‐ 2013 April 25, 2013 4
4/26/2013 Reduced Funding for Case Reviews Cost Taxpayers Billions • The 2011 Budget Control Act provided g p increased funding for SSA to conduct additional case reviews that are proven to reduce waste, fraud and abuse. • Because the additional funding support was blocked in 2012 and 2013, taxpayers will lose between $2.4 and $3.6 billion that could have been saved. April 25, 2013 5
Recommend
More recommend
Unleash a World of Digital Possibilities—Browse, Share, and Explore Content Without Boundaries