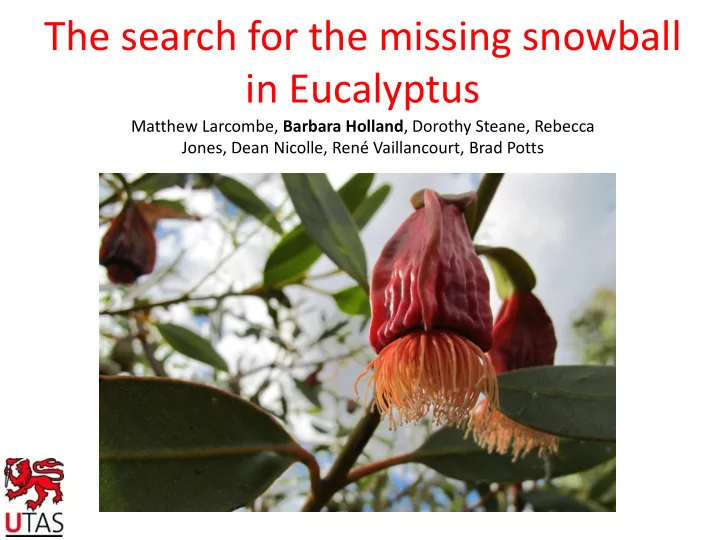

The search for the missing snowball in Eucalyptus Matthew Larcombe, Barbara Holland , Dorothy Steane, Rebecca Jones, Dean Nicolle, René Vaillancourt, Brad Potts
Reproductive isolation is central to speciation
There is an obvious relationship between reproductive isolation and genetic divergence Low High Reproductive isolation ? Low High Genetic divergence
One key question is what causes hybrid incompatibility Divergence Hybridisation Bateson 1909 Dobzhansky 1937 Muller 1942
Bateson-Dobzhansky-Muller (BDM) model of incompatibility AAbb Species 1 aabb AaBb Ancestor X Hybrid aaBB (Less compatible) Species 2 1. Minor allelic differences accumulate via drift 2. New allele combinations cause incompatibilities in hybrids 3. These accumulate over time (since divergence) 4. Ultimately lead to complete reproductive isolation
BDM model: predictions 1.Hybrid compatibility should decline with increasing divergence (genetic distance) 2.Intrinsic postzygotic barriers (BDM incompatibilities) should evolve more slowly than prezygotic barriers under selection 3.Due to negative epistasis the rate that hybrid incompatibilities accumulate should accelerate relative to the time since divergence leading a “ snowball effect”
Tests of the BDM model - comparative studies Comparative studies contrasting hybrid compatibility across linages with genetic distance are used to test the predictions of the BDM model Hybrid compatibility Genetic distance
Lots of support for the first two BDM predictions BDM prediction 1: BDM prediction 2: • Fruit fly's • Partridges • Birds • Fruit flies • Butterflies and moths • Fish • Frogs • Fish • Orchids • Catchfly • Sunflowers • …..
But evidence for the third prediction is scarce Genome 1 Genome 2 Hybrid compatibility Genetic distance
So where is the missing snowball? G&M 2010 propose two alternative snowball modes of evolution and a method for comparing : 1. Snowball = drift with epistasis linear 2. Linear = drift without epistasis slowdown 3. Slowdown = selection (reinforcement) without epistasis
So where is the missing snowball? But G&M noted some potential issues with their least-squares modelling approach: The G&M approach has been • Uses log-compatibility meaning zeros tested in: need replacing • Bacteria • Uses proportions so doesn’t account • Fungi for variation in effort • Fruit fly • Assumes normally distributed residual • butterflies errors • Shrimps • It is difficult to test differences • Starfish between un-nested models • Frogs • Birds Only minor support for the snowball effect in butterflies
Hybridisation in eucalyptus Angophora About 900 species Dean Nicolle Corymbia Dean Nicolle Eudesmia E. globulus Eucalyptus Eucalyptus 484 species Dean Nicolle Symphyomyrtus • Hybridisation does not occur between genera/subgenera but can occur within subgenera
We assessed patterns of post-mating isolation by combining controlled crossing and phylogenetics Crossing: • Currency Creek Arboretum (>900 taxa) • > 7000 flowers crossed with E. globulus pollen • 100 species • 13 taxonomic sections • Subg. Symphyomyrtus (96 spp.) R. Barbour • Subg. Eucalyptus (2 spp.) • Subg. Eudesmia (1 sp.) • Corymbia (1 sp.)
We assessed patterns of post-mating isolation by combining controlled crossing and phylogenetics Crossing: Phylogenetics: Dorothy Steane • Currency Creek Arboretum Genome-wide DArT markers: • > 7000 flowers crossed (1) 8350 markers covering all • 100 species sections but not all species • 13 taxonomic sections Rebecca Jones (2) 5050 markers covering c. 200 • Subg. Symphyomyrtus (96 spp.) R. Barbour spp. (Sections Maidenaria , • Subg. Eucalyptus (2 spp.) Latoangulatae and Exertaria ) • Subg. Eudesmia (1 sp.) including the 22 most closely • Corymbia (1 sp.) related species in this study
Compatibility declines as genetic distance increases compatibility Genetic distance explains 90 % of variation at the section level Genetic distance
Postzygotic barriers develop more slowly than prezygotic barriers Prezygotic/early postzygotic Postzygotic Genetic distance
Improved modelling approach to test for the snowball effect Barbara developed an equivalent modelling approach G&M, but using maximum likelihood instead of least-squares, that: • took into account variation in hybridisation attempts • could cope with zeros • could cope with non-normal residual errors • and enabled more simple model comparison through AIC
It seems we found the snowball! Comparison/dataset G&M best Model AIC w i P model Prezygotic/section-level linear 2017.2 0.000 linear snowball 1754.0 1.000 snowball slowdown 1952.0 0.000 slowdown 0.09 Postzygotic/section-level linear 214.9 0.000 linear snowball 197.4 0.997 snowball 0.33 slowdown 208.9 0.003 slowdown Combined/section-level linear 1812.7 0.000 linear snowball 1508.1 1.000 snowball 0.06 slowdown 1741.4 0.000 slowdown Prezygotic/species-level linear 2019.5 0.000 linear 0.47 snowball 1556.7 1.000 snowball slowdown 1574.7 0.000 slowdown Postzygotic/species-level linear 209.8 0.000 linear snowball 190.7 0.754 snowball 0.45 slowdown 192.9 0.246 slowdown Combined/species-level linear 1995.1 0.000 linear 0.44 snowball 1491.0 0.996 snowball slowdown 1502.3 0.004 slowdown
The number (as apposed to the strength) of incompatibilities has been shown to snowball
The number and the strength are not the same thing Genome 1 Genome 2 Strength is a poor proxy for the number of incompatibilities
Conclusion • We have shown that the strength as well as the number of incompatibilities can snowball with divergence. • Which may suggest, that in Eucalyptus, divergence is driven by many genes of small effect, in line with the BDM model.
Thanks to: Forest and Wood Products Australia, Cooperative Research Centre for Forestry Guy and Simone Roussel and James worth
The effect of Zeros, number of hybridisation attempts
Recommend
More recommend