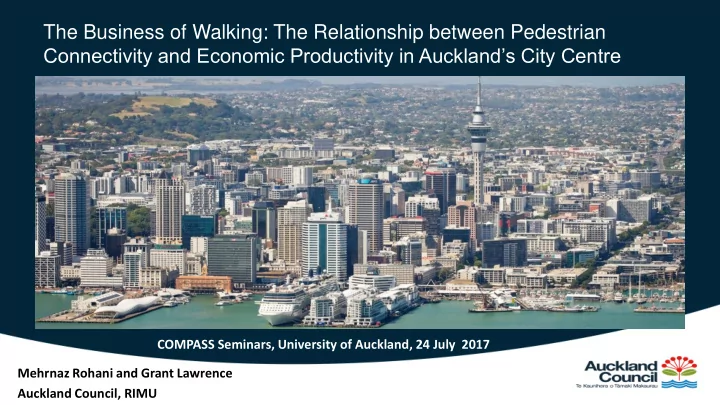

The Business of Walking: The Relationship between Pedestrian Connectivity and Economic Productivity in Auckland’s City Centre COMPASS Seminars, University of Auckland, 24 July 2017 Mehrnaz Rohani and Grant Lawrence Auckland Council, RIMU
Contents
Why this research was carried out? The city centre the economic heart of the Auckland region One of the several work streams to quantify the economic benefits of walking by Auckland Design Office To replicate, SGS (2014) methodology Strategic directors: The Auckland Plan (2012) The City Centre Master Plan (2012)
Theory
Measure of Agglomeration Economies ⍺ + 𝐹 𝐹 𝑗 𝑘 𝐹𝐾𝐸 𝑗 = ⍺ 𝑒 𝑗𝑘 𝐵𝑗 𝜌 𝑘 EJD i = the effective job density of jobs in location i E i = employment in location i (origin) E j = employment in location j (destinations) A i = the land area of area i = an estimate of the average distance between jobs within area i 𝐵𝑗 𝜌 d ij = walking distance between location i and location j (minutes) ⍺ = distance decay = 1 in this analysis
Analysis Steps 1. Defining the city centre, study area and other travel zones 2. Filling the data gaps - Developing a pedestrian network - Carrying out a census of businesses 3. Creating pedestrian travel time matrices 4. Measuring agglomeration effects: Effective Job Density (EJD) 5. Estimating labour productivity 6. Examining association between pedestrian connectivity and labour productivity
City Centre, Study Area and Travel Zones Employment Density Wynyard Qtr Ports Victoria Park Auckland Domain
10.00% 15.00% 20.00% 25.00% 30.00% 0.00% 5.00% Knowledge Hub Professional, Scientific… Share of employment in the study area Financial and Insurance… Administrative and… Accommodation and… Retail Trade Rental, Hiring and Real… Transport, Postal and… Public Administration and… Information Media and… Arts and Recreation… Health Care and Social… Wholesale Trade Other Services Education and Training Construction Manufacturing Mining Agriculture, Forestry and… Electricity, Gas, Water… 100.00% 10.00% 20.00% 30.00% 40.00% 50.00% 60.00% 70.00% 80.00% 90.00% 0.00% Professional, Scientific… Proportion of the city centre's employment Financial and Insurance… Administrative and… Accommodation and Food… Retail Trade Rental, Hiring and Real… in the study area Transport, Postal and… Public Administration and… Information Media and… Arts and Recreation… Health Care and Social… Wholesale Trade Other Services Education and Training Construction Manufacturing Mining Agriculture, Forestry and… Electricity, Gas, Water and… Total
Pedestrian Network Item Average Speed (Km/h) Footpath 5 Footway 4 Lane 4 Arcade 4 Steps 2 Shared 4 Lane 4 Controlled Crossings Short 3 Medium 2 Long 1 Uncontrolled Crossings Designated raised platforms 3 Designated refuge islands 3 Zebra crossings 3 Designated straight crossings 3 Uncontrolled intersections 3
Origins and Destinations • 304 Buildings • 408 Building entrances • 259 Meshblocks centroids
Travel Time 1 2 Displayed in seconds
Travel Time Matrices Displayed in seconds Building 3… Building Building 1 Building 2 Building 1 9.8 0.7 3.7 Building 2 0.0 10.4 7.7 Building 3 10.4 0.0 4.2 Building 4… 7.7 4.2 0.0 412000… MB 411700 411900 Building 1 28.6 27.4 24.4 Building 2 19.7 18.5 15.5 Building 3 28.8 27.7 24.7 Building 4… 25.2 24.0 21.0
Business Census
Distribution of Industries Albert Albert Park Park Aotea Aotea Sq Sq
Measure of Agglomeration Economies ⍺ + 𝐹 𝐹 𝑗 𝑘 𝐹𝐾𝐸 𝑗 = ⍺ 𝑒 𝑗𝑘 𝐵𝑗 𝜌 𝑘 EJD i = the effective job density of jobs in location i E i = employment in location i (origin) E j = employment in location j (destinations) A i = the land area of area i = an estimate of the average distance between jobs within area I 𝐵𝑗 𝜌 d ij = walking distance between location i and location j (minutes) ⍺ = distance decay = 1 in this analysis
Walking Effective Job Density Relatively higher EJD: • Along Queen Street • The eastern part of the area
Employment Density Walking Connectivity
Labour Productivity • Mean wage per worker by industry • Adjusted for industry premium in the city centre
Walking Effective Job Density and Productivity 11.80 11.60 Ln Labour Productivity 11.40 11.20 11.00 10.80 y = 0.5302x + 5.8027 10.60 R² = 0.1487 10.40 P-Value= 0.0000 10.20 9.20 9.40 9.60 9.80 10.00 10.20 10.40 10.60 10.80 Ln Effective Job Density
Employment by Industry, Auckland’s City Centre and Melbourne CBD Mining Electricity, Gas, Water and Waste Services Agriculture, Forestry and Fishing Construction Auckland's City Centre Manufacturing Other Services Melbourne CBD Arts and Recreation Services Health Care and Social Assistance Wholesale Trade Rental, Hiring and Real Estate Services Retail Trade Transport, Postal and Warehousing Public Administration and Safety Information Media and Telecommunications Education and Training Administrative and Support Services Accommodation and Food Services Financial and Insurance Services Professional, Scientific and Technical Services 0 10,000 20,000 30,000 40,000 50,000
Walking Accessibility of the study area’s fringe
Walking Effective Job Density in the Broader Travel Zones Walking Connectivity EJD Job Density
Conclusions and Next steps • Improved pedestrian connectivity = Improved city centre’s economy • Additional outcomes: Pedestrian network business profile datasets • The next phase : scenario testing • Available on: Knowledge Auckland Website
Recommend
More recommend