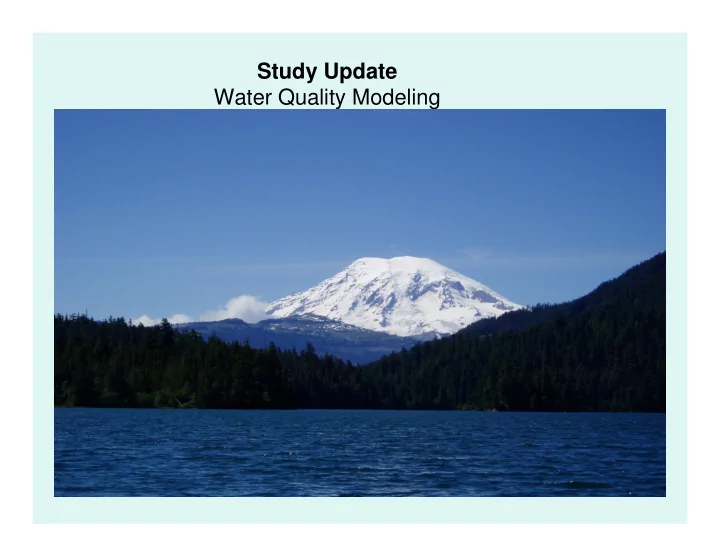

Study Update Water Quality Modeling
Lake Creek • Evaluate summer water temperature in Lake Creek downstream of Packwood Lake. • Compare temperatures for existing to without Project and natural conditions • Evaluate Project temperature loading to Cowlitz River • Evaluate relative to water quality standards for temperature
QUAL2Kw Model • Widely applied by WDOE • One dimensional model • Steady state hydraulics. Non-uniform, steady flow is simulated. • Diel heat budget. • Heat and mass inputs. Point and non- point loads and abstractions are simulated
Model Setup • Bathymetry: IFIM X-Secs; Depth and width as a function of flow • Vegetation data (available at http://www.fs.fed.us/gpnf/forest-research/gis/ applied to WDOE Shade Model • Hydrology: Existing, 7Q2, 7Q10 flows – Without Project 1912 – 1962 gage data – Accretion distributed by basin area – Hyporheic option not used
Model Setup • Existing shade approximates natural condition from lake outlet to USFS boundary Longitudinal Effective Shade Profile 100% 90% 80% Fraction of potential solar radiation blocked by topography and vegetation (%) 70% 60% 50% 40% 30% 20% 10% 0% 0 1,000 2,000 3,000 4,000 5,000 6,000 7,000 8,000 9,000 Longitudinal Distance (meters) starting at Drop Sturcture
Model Setup • Climate data available at Lake and at Packwood powerhouse • NCDC Coop station at Packwood provided supplemental data and estimating median and extreme climate conditions
Modeling dates for Lake Creek Date Air Temp Max Rationale ( o C) Aug 5 2004 26.1 Median climate 10% exceedance Aug 12 2004 33.89 climate Aug 14 2005 32.78 10% exceedance climate Aug 21 2005 26.0 Median climate
Model Calibration • Compare measured to predicted temperature at 0.5 km and 7.9 km downstream of lake • Model was primarily sensitive to groundwater (inflow rate and temperature)
Model only slightly sensitive to riparian shade August 5 2004 (7Q2 flow and average climate conditions) 25 Maximum Daily Water 20 Temperature (C) 15 10 5 0 0.00 1.00 2.00 3.00 4.00 5.00 6.00 7.00 8.00 9.00 Distance Downstream of Lake (km) Without Project Without Project No riparian shade
Model Calibration • Predicted Maximum daily -0.24C cooler, on average, than measured • Predicted Mean daily 0.4C warmer, on average, than measured • Predicted Minimum within 0.1C of measured ���������������������� ���������������������� ���������������������� ���������������������� �� �� ������������������� �� �� � � � � � � � � � � � ������������������������ ��������� ����� !��������"���� ��������!������ ��������!�#���� !�����������"���� !�#���������"����
August 14, 2005 10% exceedance climate 25 Maximum Daily Water Temperature (C) 20 15 10 5 0 0.00 1.00 2.00 3.00 4.00 5.00 6.00 7.00 8.00 9.00 Distance Downstream of Lake (km) with Project Without Project 7Q10 7Q2
7DADMax • Modeled with and without Project for August 15- 21, 2004 (highest on record below drop structure) • Natural inflow to lake applied: 15% above 7Q10 outflow • Calibration: Absolute mean error at Rkm 0.5= 0.22C and at Rkm 7.9 = 0.16C • 7DADMax without Project = 19.27C • 7DADMax existing = 14.16C • 7DADMax tailrace lower end = 21.25C • Combined flow weighted average 7DADMax for Lake Creek at mouth and lower tailrace =19.92C
Downstream Temperature Effect • Mass Balance/Energy analysis • Lake Creek flow and tailrace flow • Analyzed for 7Q2 and 7Q10 flows • Assumed full instantaneous mixing without accounting for tailrace slough • No significant temperature effect on summer Cowlitz River temperatures
Summary • Temperature just downstream of lake is function of lake outflow temperature • Temperature near mouth is a function of cool groundwater inflow • Effect of Project is cooler summer temperatures in Lake Creek • Flow weighted average 7DADMax (Lake Creek + tailrace) slightly warmer than 7DADMax for natural condition in Lake Creek • No downstream temperature effect for Cowlitz R. • Water quality modeling for lake is in progress
Recommend
More recommend