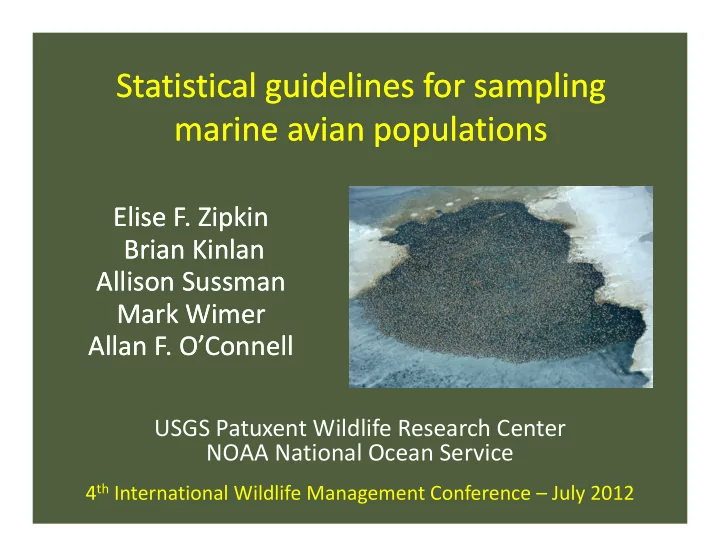

Statistical guidelines for sampling Statistical guidelines for sampling marine avian populations marine avian populations Elise F. Zipkin Elise F. Zipkin Brian Kinlan Brian Kinlan Allison Sussman Allison Sussman Mark Wimer Mark Wimer Allan F. O’Connell Allan F. O’Connell USGS Patuxent Wildlife Research Center NOAA National Ocean Service 4 th International Wildlife Management Conference – July 2012
Seabirds in the Atlantic
Where are the birds? Not a lot known about the distribution and abundances in the Atlantic • Difficult to survey • Rough conditions • Patchily distributed • Highly mobile
Where are the birds? Wind development Off shore wind power garnering lots of interest • Many states have implemented a 20% renewable energy by 2020 mandate • Public perception of oil spills is poor
Patuxent Wildlife Research Center U.S. Bureau of Ocean and Energy Management (BOEM) • 5km x 5km lease blocks • Along the Outer Continental Shelf of the Atlantic Ocean All Lease Blocks
Objectives Develop a framework for assessing: 1) which lease blocks are “hot spots” and “cold spots” 2) the required surveying effort to guide BOEM and industry in determining wind turbine placement
What is a hot/cold spot? Hot spot = A lease block with an average species specific abundance that is three times the mean of the region Cold spot = A lease block with an average species specific abundance that is one third the mean of the region
The Atlantic Seabird Compendium • >250,000 seabird observations from U.S. Atlantic waters • Collected from 1978 through 2011 • Data collected using a mix of methods including non ‐ scientific approaches
The Atlantic Seabird Compendium • >250,000 seabird observations from U.S. Atlantic waters • Collected from 1978 through 2011 • Data collected using a mix of methods including non ‐ scientific approaches We used: • 32 scientific data sets – 28 ship ‐ based, 4 aerial • Transects were standardized to 4.63km • 44,176 survey transects representing 463 species
Two part approach 1) Determine the best statistical distribution to model the count data for each species in each season 2) Use the best fitting distribution to produce power analyses
The rest of the talk 1) Describe the broad two part approach 2) Integrate an example using Northern Gannets
Two part approach 1) Determine the best statistical distribution to model the count data for each species in each season 2) Use the best fitting distribution to produce power analyses
Part 1: Model the data Test eight statistical distributions: Northern Gannet Poisson spring count data Negative binomial Geometric Logarithmic Discretized lognormal Zeta decay Yule Zeta (power law)
Examples of the distributions Positive Poisson (simulated) 1e-01 Discretized lognormal (simulated) 1e-03 1e-01 1e-05 1e-03 1 2 5 10 20 1e-05 Positive neg binomial (simulated) 1e-01 1 5 10 50 100 500 1000 1e-03 Zeta (simulated) 1e-01 1e-05 1e-03 1 2 5 10 20 50 100 200 1e-05 Positive geometric (simulated) 1e-01 1 100 10000 1e-03 Yule (simulated) 1e-01 1e-05 1e-03 1 2 5 10 20 50 100 Logarithmic (simulated) 1e-05 1e-01 1 100 10000 1e-03 1e-05 1 2 5 10 20 50 100 200
Part 1: Results Spring Summer Fall Winter Total Number species with 12 10 15 11 48 >500 observations
Part 1: Results Spring Summer Fall Winter Total Number species with 12 10 15 11 48 >500 observations Discretized lognormal Yule Negative binomial Logarithmic Zeta decay
Part 1: Results Spring Summer Fall Winter Total Number species with 12 10 15 11 48 >500 observations Discretized lognormal 7 (4*) 4 (3*) 8 (3*) 8 (2*) 27 (12*) Yule 1* 3* 1* 1 1 (5*) Negative binomial Logarithmic 3* 0 (3*) Zeta decay
Part 1: Results 1e+00 Discretized lognormal Yule Northern Gannet Probability (log scale) Zeta decay 1e-01 Zeta Discretized lognormal 1e-02 top distribution for fall and spring 1e-03 Discretized lognormal and Yule fit equally well 1e-04 in winter and summer 1 5 10 50 500 Count (log scale)
Two part approach 1) Determine the best statistical distribution to model the count data for each species in each season 2) Use the best fitting distribution to produce power analyses
Part 2: Power analysis
Part 2: Power analysis for Northern gannets in the spring *Focusing only on lease blocks where individuals were observed
Part 2: Northern gannet results Reference mean = 6.9 individuals per lease block conditional on presence
Part 2: Northern gannet results 1.0 Hot spot (3 x mean) Reference mean = 6.9 Cold spot (0.33 x mean) individuals per lease 0.8 block conditional on Simulated power presence 0.6 0.4 0.2 0.0 5 10 15 20 25 Number of sampling events
Part 2: Northern gannet results 1.0 Hot spot (3 x mean) Reference mean = 6.9 Cold spot (0.33 x mean) individuals per lease 0.8 block conditional on Simulated power presence 0.6 0.4 Discretized lognormal 1e-01 Frequency 0.2 1e-03 1e-05 1 5 10 50 100 500 1000 Counts 0.0 5 10 15 20 25 Number of sampling events
Part 2: Northern gannet results
Summary of results • Seabirds tend to be highly aggregated and require skewed statistical distributions to accurately describe populations • For many species, we need a large number of surveys to detect areas with atypical abundances
Implications for wind power • Intensive sampling in multiple seasons will be required to determine potential impacts on seabirds • A possible approach could be to combine data on functionally similar species or species of high conservation value
Acknowledgments • The many researchers and their crews who collected the data used in our analyses • Emily Silverman, Diana Rypkema • The Bureau of Ocean, Energy, Management (BOEM) for funding model development and analysis
Recommend
More recommend