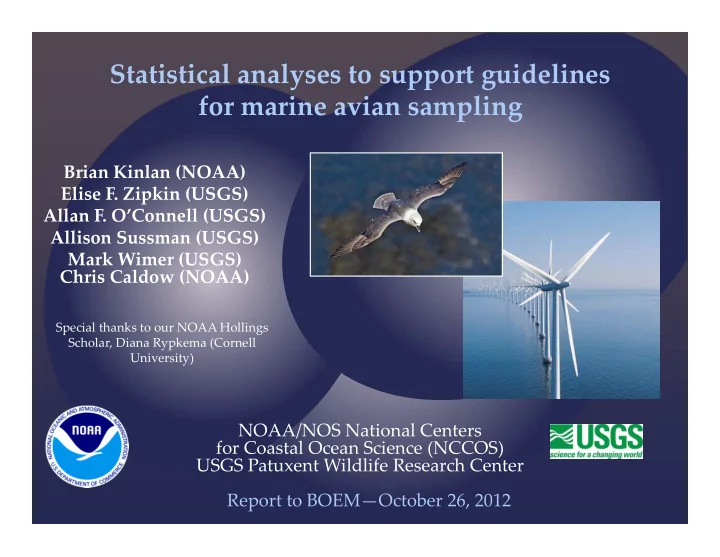

Statistical analyses to support guidelines for marine avian sampling Brian Kinlan (NOAA) Elise F. Zipkin (USGS) Allan F. O’Connell (USGS) Allison Sussman (USGS) Mark Wimer (USGS) Chris Caldow (NOAA) Special thanks to our NOAA Hollings Scholar, Diana Rypkema (Cornell University) NOAA/NOS National Centers for Coastal Ocean Science (NCCOS) USGS Patuxent Wildlife Research Center Report to BOEM—October 26, 2012
Offshore Wind Off shore wind power garnering lots of interest • Many states have implemented a 20% renewable energy by 2020 mandate • Need for siting and environmental assessment
Where are birds more likely to aggregate? Not a lot known about the distribution and abundances in the Atlantic • Difficult to survey • Rough conditions • Patchily distributed • Highly mobile/variable
Patuxent Wildlife Research Center U.S. Bureau of Ocean and Energy Management (BOEM) • 5km x 5km lease blocks • Along the Outer Continental Shelf of the Atlantic Ocean All Lease Blocks
Objectives Develop a framework for assessing: 1) which lease blocks are “hot spots” and “cold spots” 2) the required survey effort to guide BOEM and industry in determining wind turbine placement
What is a hot/coldspot? Hot spot = A lease block with an average species specific abundance that is some multiple >1 (e.g., 3x) the mean of the region Cold spot = A lease block with an average species specific abundance that is some multiple <1 (e.g., 1/3x) the mean of the region
How many surveys?
The Atlantic Seabird Compendium • >250,000 seabird observations from U.S. Atlantic waters • Collected from 1978 through 2011 • Data collected using a mix of methods including non ‐ scientific approaches
The Atlantic Seabird Compendium • >250,000 seabird observations from U.S. Atlantic waters • Collected from 1978 through 2011 • Data collected using a mix of methods including non ‐ scientific approaches We used: • 32 scientific data sets – 28 ship ‐ based, 4 aerial • Transects were standardized to 4.63km • 44,176 survey transects representing 463 species
Two part approach 1) Determine the best statistical distribution to model the count data for each species in each season 2) Conduct power analysis and significance testing on the basis of this distribution
Two part approach 1) Determine the best statistical distribution to model the count data for each species in each season 2) Conduct power analysis and significance testing on the basis of this distribution
Model the data Northern Gannet Spring Count Data Test eight statistical distributions: Poisson Negative binomial Geometric Logarithmic Discretized lognormal Zeta ‐ exponential Yule Zeta (power law)
Model the data Northern Gannet Spring Count Data Test eight statistical distributions: Poisson Negative binomial Geometric Logarithmic Discretized lognormal Zeta exponential Yule Zeta (power law)
Examples of the distributions Positive Poisson (simulated) 1e-01 Discretized lognormal (simulated) 1e-03 1e-01 1e-05 1e-03 1 2 5 10 20 1e-05 Positive neg binomial (simulated) 1e-01 1 5 10 50 100 500 1000 1e-03 Zeta (simulated) 1e-01 1e-05 1e-03 1 2 5 10 20 50 100 200 1e-05 Positive geometric (simulated) 1e-01 1 100 10000 1e-03 Yule (simulated) 1e-01 1e-05 1e-03 1 2 5 10 20 50 100 Logarithmic (simulated) 1e-05 1e-01 1 100 10000 1e-03 1e-05 1 2 5 10 20 50 100 200
Results ‐ Model Fitting Spring Summer Fall Winter Total Number species with 12 10 15 11 48 >500 observations
Results ‐ Model Fitting Spring Summer Fall Winter Total Number species with 12 10 15 11 48 >500 observations Discretized lognormal Yule Negative binomial Logarithmic Zeta decay
Results ‐ Model Fitting Spring Summer Fall Winter Total Number species with 12 10 15 11 48 >500 observations Discretized lognormal 7 (4*) 4 (3*) 8 (3*) 8 (2*) 27 (12*) 1* 3* 1* 1 1 (5*) Yule Negative binomial 3* 0 (3*) Logarithmic Zeta decay *Not significantly better for α = 0.05
Discretized Lognormal Distribution • Criteria: • Positive • Non ‐ zero values • Highly skewed • Multiplicative effects
Model fit Power Analysis Power curves Model selection 1e+00 1.0 Hot spot (3 x mean) Discretized lognormal Cold spot (0.33 x mean) Yule Probability (log scale) Zeta decay 0.8 1e-01 Zeta Simulated power 0.6 1e-02 0.4 1e-03 0.2 1e-04 1 5 10 50 500 0.0 Count (log scale) Power Maps & Significance tests 5 10 15 20 25 Number of sampling events
Products • Interim report (Jan 2012) • Mid ‐ Term Technical Report (July 2012) • Presented at 4th International Wildlife Management Conference in South Africa (July 2012) • First peer ‐ reviewed journal article published in J. Statistical Methodology (Zipkin et al. 2012). • Second journal article in prep for submission in Nov ‐ Dec 2012 • Final report (Oct ‐ Nov 2012) • Digital data ‐ PDF, ArcGIS (Nov 2012)
Broad summary of results • Useful technique • Need to do additional focal work on key species of interest • Most areas of the Atlantic need additional sampling to have adequate power to detect hotspots/coldspots • Maps could be used to select well ‐ studied areas where less additional sampling required • Rare species a challenge
Discussion • Overview of draft final report • General walk ‐ through • Look at and discuss results for species of interest • Discuss issues • Spatial scale • Temporal scale/environmental variability • Spatial and temporal trends • Rare species/data poor situations • Comparison to other approaches • Detectability and other observer/platform issues • Next steps/practical applications
Acknowledgements Mid-Atlantic Predictive Sampling Design/Power Modeling Project Analysis Project Rob Rankin (NOAA Biogeo) Diana Rypkema (NOAA Hollings Scholar) Allan O’Connell (USGS-Patuxent) Emily Silverman (USFWS) Andrew Gilbert (BRI) Jeffery Leirness (USFWS) Beth Gardner (NC State) Mark Wimer (USGS Patuxent) Technical Reviewers – Jim Baldwin (USDA Allison Sussman (USGS Patuxent) Forest Service), Jocelyn Brown-Saracino Charlie Menza (NOAA Biogeo) (DOE), David Bigger (BOEM), BOEM Chris Caldow (NOAA Biogeo) Renewable Energy/Avian Biology Team Tom McGrath (NOAA Biogeo) & others Data : Atlantic Seabird Survey Compendium Data : Atlantic Seabird Survey Compendium Funding: BOEM, USGS Funding: BOEM, USGS Brian.Kinlan@NOAA.gov 301 ‐ 713 ‐ 3028 x157
Recommend
More recommend