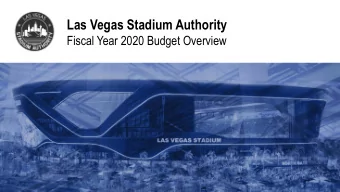
Stadium Proposal Review of Proposal | Update on Modeling Progress - PowerPoint PPT Presentation
DRAFT | For Discussion Purposes Stadium Proposal Review of Proposal | Update on Modeling Progress OVERVIEW OF BASELINE MODEL 2 State of Nevada Creates Stadium Authority via State Legislation $750 MM $750 MM Las Vegas How the Clark County
DRAFT | For Discussion Purposes Stadium Proposal Review of Proposal | Update on Modeling Progress
OVERVIEW OF BASELINE MODEL 2
State of Nevada Creates Stadium Authority via State Legislation $750 MM $750 MM Las Vegas How the Clark County Construction Stadium (TBD) Loan Agreement Fund Authority 1 Where Stadium Stadium Authority Sends Ground Tax Revenue to Lease $650 MM Proposal is Clark County Sands / Majestic Las Vegas Currently Non-Relocation Events Center Agreement (“EventsCo”) Structured $410 MM Stadium (NFL G-4, Net PSL Proceeds, Lease and Other Sources 2 ) Raiders Stadium Company Stadium (“Raiders StadCo”) Sub-Lease 1 Assumed to be a newly created entity that is separate and distinct from the Las Vegas Convention and Visitors Authority 2 $200MM face value of PSLs sold resulting in after-tax proceeds of $110 MM plus $200 MM of G-4 Loan and $100MM Contribution from Raiders Source: LVS-Majestic Model, May 2016. 3
SOURCES OF FUNDS Public Contribution $ 750,000,000 Net NFL PSLs (Face Value: $200m) 1 110,000,000 NFL G-4 2 200,000,000 Other Raiders Contribution 100,000,000 Project Sands/Majestic Equity and Debt 240,000,000 Sources and TOTAL SOURCES $ 1,400,000,000 Uses USES OF FUNDS Stadium Project Hard and Soft Costs $ 1,300,000,000 Practice Facility 100,000,000 TOTAL USES $ 1,400,000,000 1 Number is an estimate 2 Subject to NFL approval 4
Developer Assumes Construction and Operating Risk Developer assumes the risk in the event of construction cost overages Land acquisition is not currently reflected in the model; this is likely to increase the developer cost There are other potential cost elements (i.e., team relocation fee) that are not included; Material developer assumes the risk for the additional costs not otherwise noted Considerations Considerations Outside the Model Third parties, including the NFL, event promoters and concessionaires, receive revenue from stadium activities but are not fully analyzed in the model Potential implications for UNLV not fully reflected in the model Ancillary infrastructure costs on state and local government not reflected in the model 5
State of Nevada Creates Stadium Authority via State Legislation The Stadium $750 MM $750 MM Las Vegas Clark County Authority Provides Construction Stadium (TBD) Loan Agreement Fund Authority 1 Oversight, Collects Where Stadium Authority Sends Ground Tax Revenue to Lease Tax Revenues, $650 MM Clark County Sands / Majestic Pays Bonds, Funds Las Vegas Non-Relocation Events Center Agreement Annual Capital and (“EventsCo”) $410 MM Stadium (NFL G-4, Net PSL Proceeds, Offsets UNLV’s Lease and Other Sources 2 ) Losses Raiders Stadium Company Stadium (“Raiders StadCo”) Sub-Lease 1 Assumed to be a newly created entity that is separate and distinct from the Las Vegas Convention and Visitors Authority 2 $200MM face value of PSLs sold resulting in after-tax proceeds of $110 MM plus $200 MM of G-4 Loan and $100MM Contribution from Raiders Source: LVS-Majestic Model, May 2016. 6
NFL Stadium Model Stadium Authority Revenues | Sources (in Millions) $70 Millions $60 The Public Sector $50 $750M Contribution $40 is Funded Through $30 a 1.0% Room Tax $20 $10 $0 FY2017 FY2022 FY2027 FY2032 FY2037 FY2042 FY2047 FY2052 Source: LVS-Majestic Model, May 2016. 7
NFL Stadium Model Stadium Authority Revenues | Sources (in Millions) $70 Millions Room Tax Begins $60 January 1, 2017; Pay-Go First Two Years Will $50 Accrue and be $40 Used as Pay-Go $30 Funding, Assuming $20 All Other Hurdles are Met $10 $0 FY2017 FY2022 FY2027 FY2032 FY2037 FY2042 FY2047 FY2052 Source: LVS-Majestic Model, May 2016. 8
NFL Stadium Model Stadium Authority Revenues | Sources (in Millions) $70 Millions $60 Pay-Go Room Tax is $50 Coverage: ~ 1.5x Sufficient to Fund $40 Public Debt, $30 Including Coverage $20 Debt Service $10 $0 FY2017 FY2022 FY2027 FY2032 FY2037 FY2042 FY2047 FY2052 Source: LVS-Majestic Model, May 2016. 9
NFL Stadium Model Stadium Authority Revenues | Sources (in Millions) $70 Millions If Coverage is $60 Pay-Go Allocated to Debt $50 Coverage Service, Public $40 Debt Would Be $30 Paid Off by FY2033 $20 Debt Service $10 $0 FY2017 FY2022 FY2027 FY2032 FY2037 FY2042 FY2047 FY2052 Source: LVS-Majestic Model, May 2016. 10
NFL Stadium Model Stadium Authority Revenues | Sources (in Millions) Tax Increment $90 Live Entertainment Tax: $7.0M/Year $80 Sourced to Sales Tax: $3.4M/Year $70 Stadium-Related $60 Sales Tax, Live $50 Entertainment Tax $40 and Modified $30 Business Tax also $20 Inures to the $10 Room Tax Stadium Authority $0 FY2017 FY2022 FY2027 FY2032 FY2037 FY2042 FY2047 FY2052 Source: LVS-Majestic Model, May 2016. 11
NFL Stadium Model Stadium Authority Stadium Authority | Sources (in Millions) Funds are Used to $60 Capital Contribution Millions Repay Debt, Fund UNLV Payment $50 Annual Capital and Debt Payments Offset Losses to $40 UNLV $30 $20 Assumptions: Bond Principal: $572M $10 Bond Interest: $577M UNLV Payment: $221M $0 Annual Capital: $158M Coverage: $1.1B Total: $2.63B Source: LVS-Majestic Model, May 2016. 12
State of Nevada A Separate Creates Stadium Authority Stadium/Event via State Legislation $750 MM $750 MM Las Vegas Company Oversees Clark County Construction Stadium (TBD) Loan Agreement Fund Authority 1 the Day-to-Day Where Stadium Authority Sends Ground Operations of the Tax Revenue to Lease $650 MM Clark County Sands / Majestic Stadium Itself and Las Vegas Non-Relocation Events Center Provide for Agreement (“EventsCo”) $410 MM Stadium Operating Cash (NFL G-4, Net PSL Proceeds, Lease and Other Sources 2 ) Flow Shortfalls Raiders Stadium Company Stadium (“Raiders StadCo”) Sub-Lease 1 Assumed to be a newly created entity that is separate and distinct from the Las Vegas Convention and Visitors Authority 2 $200MM face value of PSLs sold resulting in after-tax proceeds of $110 MM plus $200 MM of G-4 Loan and $100MM Contribution from Raiders Source: LVS-Majestic Model, May 2016. 13
Total Stadium Revenue: $264 Million (Annual) Events: 46 Seats: 65,000 Premium suites: 70 Party suites: 30 Stadium Club seats: 6,000 Total annual attendance: 1.97 Million (42,841 per event) Operating Event occupancy rate: ~70.0% Total ticket revenue: $161M (Average: $92.16) Assumptions Facility rent: $9.0M Facility fees: $4.2M (@ $2.00 per ticket) Ticketmaster fees: $2.8M Suite revenue (net): $22.1M Club seat revenue (net): $14.3M Concessions revenue: $31.6M ($17 per capita) Merchandise revenue (net): $12.4M Parking revenue (net): $5.5M Source: LVS-Majestic Model, May 2016 14
NFL 32.8% The Stadium Operator Retains Only Stadium Operator About 11.7% 11.7% Event of Operating 43.6% Revenues Concessionaire 11.6% Other 0.3% Source: LVS-Majestic Model, May 2016 15
Revenues Retained by Stadium Operator NFL 32.8% Facility Rent $8,992,037 28.9% General Concessions $6,458,146 20.7% Premium - Suites $5,138,850 16.5% Facility Fees $4,245,404 13.6% Stadium Premium - Party Suites $2,087,014 6.7% Parking Revenue $1,862,684 6.0% Operator Ticket Master Rebates $1,166,091 3.7% 11.7% Event Merchandise Revenue $1,041,727 3.3% Premium Concessions - Suites $152,163 0.5% 43.6% Ticket Revenue $0 0.0% Premium - Club Suites $0 0.0% Premium Concessions - Club Seats $0 0.0% Total $31,144,115 100.0% Concessionaire 11.6% Other 0.3% Source: LVS-Majestic Model, May 2016 16
Non-Event Revenues NFL Team Stadium Concessionaire UNLV Total Naming Rights (Net) $5.53 $1.84 $0.00 $0.00 $7.38 Catered Events (Net) $0.00 $0.32 $0.00 $0.00 $0.32 Team Online Sales (Net) $0.04 $0.00 $0.21 $0.00 $0.25 Advertising & Sponsorship (Net) $19.08 $6.36 $0.00 $0.00 $25.44 Facility Tours (Net) $1.80 $1.80 $0.00 $0.00 $3.59 Non-Event Non-Team Game Day Sales $0.08 $0.00 $0.43 $0.00 $0.50 Total $26.52 $10.32 $0.64 $0.00 $37.48 Related Revenue The Stadium Operator Assumptions Stadium retains roughly 27.5% of all Operator 27.5% non-event related revenue, NFL 70.8% with the most significant source being advertising Concessionaire and sponsorships 1.7% UNLV 0.0% 17
Total Revenue: $41.5M EVENT REVENUE Event Rent $8,992,037 Facility Fees $4,245,404 Suites (Net) $7,225,864 General Concessions (Net) $6,458,146 Event Non-Event Premium Concessions (Net) $152,163 Revenue Revenue Merchandise (Net) $1,041,727 75% 25% Parking (Net) $1,862,684 Ticketmaster Rebates (Net) $1,166,091 Total Event Revenue $31,144,115 Operating Cash NON-EVENT REVENUE Catered Events & Tours $2,117,500 Naming Rights, Net fulfillment $1,844,219 Flows Total Expenses: $36.0M Other Sponsorship, Net fulfillment $6,359,375 Total Non-Event Revenue $10,321,094 OPERATING EXPENSES Annual Operating Expenses $21,537,313 Debt Service and Capital NET OPERATING INCOME $19,927,367 40% Operating DEBT SERVICE AND CAPITAL Expenses Debt Service $12,000,000 60% Capital Expenditures 2,500,000 Total Debt Service and Capital $14,500,000 FREE CASH FLOW $5,427,364 18
Recommend


More recommend
Explore More Topics
Stay informed with curated content and fresh updates.