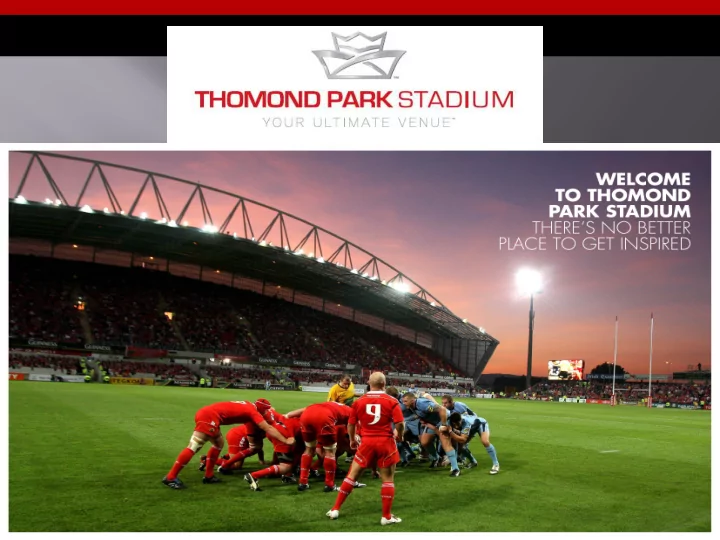

The stadium has changed the skyline in Limerick forever. Now the province has a multi-purpose stadium facility to rival any modern stadia across Europe
SCALE OF IMPACTS ASSESSMENT Prior to stadium completion Heineken Cup game resulted in € 3.5 million economic impact on city. New Stadium has increased economic benefit to € 10 million per HC game based on completed 26,000 capacity and ability to accommodate additional visiting and home supporters. Over 1.6 million people have come through the doors of Thomond Park Stadium since it’s redevelopment- this includes attending games, concerts, conferences, special events, etc.
Economic impact study of events hosted at Thomond Park from September 2008 to June 2010 was € 131.8 million for Limerick and region. Visitors to the stadium at this stage stood at 700,000. Direct expenditure as a result of events is € 78 million into the local economy. Estimated return to the exchequer is in the region of € 23 million. Events hosted have resulted in € 560,000 in casual wages paid annually to local people in event day operational areas such as stewarding, catering and hospitality. The scale of part time employment is evident in the 800 people employed on match day across all aspects of stadium operations. The employment equivalent from the economic activity generated by stadium is the equivalent of a local company employing 565 people annually in full time roles.
q Approx 100 suppliers are retained by Thomond Park and its contractors to deliver services and products for events. q Stadium is now an integral part of the marketing of Limerick as a host destination for international sports and business events. TPSL is now included in the top international stadia listing in Europe for sports events and concerts by promoters and have resulted in attracting many of the worlds largest event promoters visiting Limerick to view the facilities to consider it as a future event host.
Stadium Impacts • Social • Economic • Environmental
Event Management • Code of Practice (Dept of Education 1996) • Green Guide (UK) • ISO 20121 Sustainable Event Management
EVENT ORGANISATION Event Controller Radio Diarist Operator Facility Management Safety Officer Civil Defence Munster Local Chief Coordinato Media Ticketing Catering Security Agencies Steward r Gardaí Written Ambulanc Security Síochána Press e Service Steward Personnel Supervisors Photographe Red Cross rs Stewards Limerick TV & City Radio Council
Facility Management
Planning and Preparation § Holistic Approach/Start Of Journey § Waste § Water § Electricity § Gas § Miscellaneous
Waste § We worked closely with the regional waste management office to audit our waste and implement waste reduction measures. § Worked with our catering partners in reducing the amount of waste and packaging that comes into the stadium. § Designed our own bins for usage around the stadium. § Put the recycling message in programmes and match. Announcements. § Trained staff on waste streams and proper waste management. § Place bins outside the stadium on event days in conjunction with Limerick City Council.
Waste Waste ¡report ¡Thomond ¡2012 Compactor 240l Monthly Recycling Recycling Glass Food Waste Waste COST Monthly ¡percentages Month Kg's Kg's Kg's Kg's Kg's Jan 1236 360 1218 0 270 91.25% Feb 698 360 1038 0 408 83.71% Mar 1080 360 1140 0 108 95.98% Apr 1470 360 1793 0 376 90.60% May 1384 360 1054 0 0 100.00% Jun 989 360 1049 0 124 95.08% Jul 564 360 648 0 0 100.00% Aug 842 360 992 726 75.14% Sep 2220 360 1110 0 100.00% Oct 2518 360 1230 152 96.43% Nov 1145 360 1666 200 94.07% Dec 1302 360 1200 260 91.67% Overall ¡percentage Totals 15448 4320 14138 0 2624 92.82% Cost 0
Water § Waterless urinals fitted throughout the stadium and a new ballcock system in the water harvesting tank. § Valves fitted throughout the stadium for easier control of water usage. § Meters fitted throughout the stadium to monitor consumption. § Use of watering agents on pitch during long dry spells. § Water consumption 2009 14,612M 3 § Water consumption 2010 6,705M 3 § Water consumption 2011 4,186M 3 § Water consumption 2012 3,140M 3
Electricity § We fitted PIR’s and efficient lighting systems in parts of the stadium and will continue to roll out more efficient systems as part of the general maintenance program. § The switch off policy at the stadium has helped reduce overall consumption. (Turn off all non essential systems and lights). § We fitted meters throughout the stadium to monitor consumption and investigates any increases in consumption. § Average consumption per individual 2009 3.23Kwhr § Average consumption per individual 2010 2.87Kwhr § Average consumption per individual 2011 2.82Kwhr § Average consumption per individual 2012 2.73Kwhr
Gas § We fitted meters throughout the stadium to monitor consumption. § We adopted a strict turn off policy to reduce the consumption. § Average consumption per individual 2009 0.737Kwhr § Average consumption per individual 2010 0.721Kwhr § Average consumption per individual 2011 0.667Kwhr § Average consumption per individual 2012 0.725Kwhr
Miscellaneous § We have reduced our overall carbon footprint by 15%. § We developed park and ride plan for events and have increased the number of people using the park and ride to an average of 9000 per big event. § We stopped the use of black plastic bags in the stadium and now only use clear compostable or biodegrabeable bags. § We have reduced our consumption of diesel by 50% with the generators for the floodlights. § We have investigated the use of solar, wind and CHP within the stadium and have priced a CHP plant to use the waste heat for undersoil heating. § We planted trees in Dromoland Castle as part of their green initiative (Tress supplied by Dundrum Nurseries). § We are looking forward at other green initiatives such as CHP, green branded products etc.
Assessment § Benchmarking § Continuous Improvement § Improved Understanding § Financial Rewards § Reduced Carbon Footprint
Recommend
More recommend