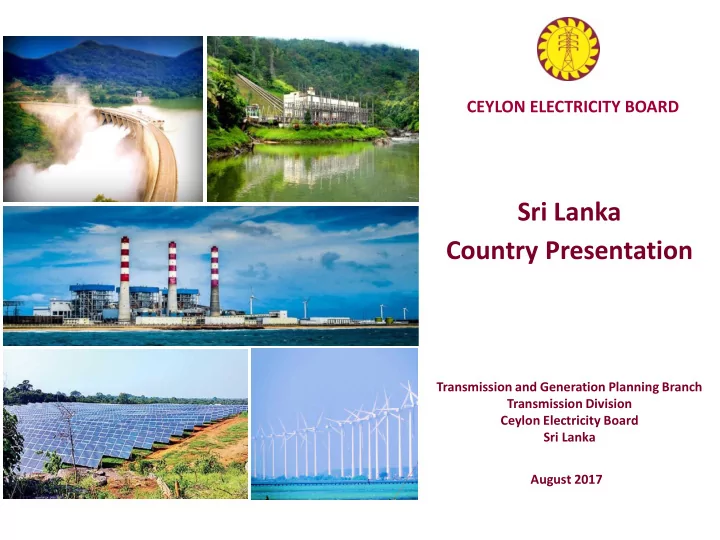

CEYLON ELECTRICITY BOARD Sri Lanka Country Presentation Transmission and Generation Planning Branch Transmission Division Ceylon Electricity Board Sri Lanka August 2017
INTRODUCTION • Total Area : 65,610 km2 SRI LANKA • Land Area : 62,705 km2 • Population : 21.2 million • Urban : 18.3% Rural : 81.7% • Population Density : 338 per/ sqkm • Labour Force : 8.311 million • Unemployment rate : 4.4% • Literacy rate : 93.3% • Life expectancy: 72 yrs (M), 78 yrs (F) • Monetary Unit : Sri Lankan Rupee (1 USD = 151.9 LKR at January 2017) • Gross Domestic Product : 11,839 billion LKR (Market Prices) • GDP per capita : 3,835 US$ (Market Prices) • GDP structure 2016 • Agriculture – 7.1% • Industry – 26.8% • Services – 56.5% • Taxes less subsidies on products – 9.6% 2
SRI LANKAN POWER SECTOR ❖ Installed capacity 4,018 MW ❖ Peak Demand 2,483 MW ❖ Energy Demand 12,785 GWh ❖ Electricity Generated 14,249 GWh ❖ System Losses 10.28 % ❖ Elec. Consumption per Capita 603 kWh ❖ Level of Electrification 98.71% (June 2016)
PRESENT CAPACITY & ENERY MIX AS AT DECEMBER 2016 Total Installed Capacity & Energy Source Capacity (MW) Energy (GWh) Renewable - CEB & SPP 1,903 4,659 CEB Thermal - Coal 900 5,067 CEB Thermal - Oil 604 2,360 IPP Thermal 611 2,164 Total 4,018 14,249 Capacity Share (MW) Energy Share (GWh) CEB Thermal - Coal CEB Thermal - Coal 23% 33% 35% CEB Thermal - Oil CEB Thermal - Oil 47% IPP Thermal IPP Thermal 15% 15% Renewable - CEB & SPP Renewable - CEB & SPP 17% 15% 4
RENEWABLE ENERGY AS AT DECEMBER 2016 Renewable Energy Contribution Major Hydro Other RE Total RE Percentage 8000 70% 7000 60% 6000 50% Energy (Gwh) 5000 Percentage 40% 4000 30% 3000 20% 2000 10% 1000 0 0% 2006 2007 2008 2009 2010 2011 2012 2013 2014 2015 2016 Year 5
Average Cost per Unit for Generation Technologies AS AT DECEMBER 2016 30.00 25.00 28.37 Average cost at selling point in 2016 = 18.09 24.34 Unit Cost (LKR/kWh) 20.00 Average cost at selling point in 2015 = 15.06 15.00 17.59 10.00 5.00 2.32 6.58 - CEB Hydro CEB Coal Renewables CEB Thermal IPP Thermal Generation Technology 6
TYPICAL LOAD CURVE OF SRI LANKA Daily Load Curve as at 17 th May 2017 3000 2500 2000 Demand (MW) 1500 1000 500 0 Time 7
TYPICAL LOAD CURVE OF SRI LANKA Daily Load Curve as at 17 th May 2017 – Generation Mix CEB - Coal CEB - Thermal IPP Renewable Hydro 3000 2500 2000 Demand (MW) 1500 1000 500 0 Time 8
THANK YOU 9
Recommend
More recommend