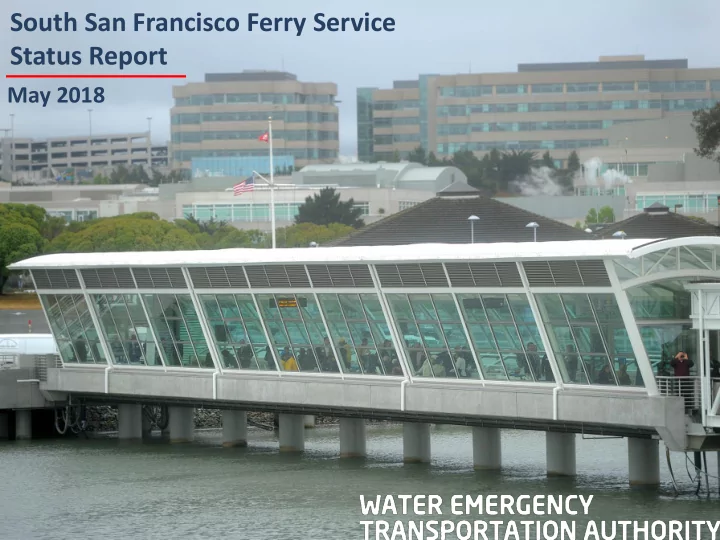

South San Francisco Ferry Service Status Report May 2018
Average Daily Ridership, South San Francisco Ferry Service Year One Year 6 Year Five Year Two Year Three Year Four 333 daily boardings 161 daily boardings 422 daily boardings 479 daily boardings 514 daily boardings 552 2
Average Monthly Farebox Recovery Current Average: 36% 3
Regional Measure 2 Program: Performance Criteria • Project has two years of ramp up and must reach threshold farebox recovery by the third year Service Type Ferry Rail Bus Peak Service 40% 35% 30% All Day 30% 25% 20% Service Owl Service N/A N/A 10% • Services that do not meet above thresholds in Year 3 must complete a Corrective Action Plan and submit to MTC for approval • Ferry services are evaluated as individual routes, and not part of a larger system or program of services 4
WETA, San Mateo County Stakeholders WETA made an appeal in the Fall of 2015 to extend the deadline for Regional Measure 2 funding for South San Francisco Ferry • Letters of support from South San Francisco ferry stakeholders • San Mateo Transportation Authority • SAMCEDA, Bay Area Council • Commute.org • City of South San Francisco • City of Alameda • Master’s Mate’s & Pilots • Supervisor Pine 5
South San Francisco Ferry Service Timeline 665 +378% Ferry service begins 560 +303% 514 +270% 465 +234% Avg. Daily Boarding Growth since Year 1 361 +160% 256 +84% 2018 2017 2016 2015 2013 2014 2012 2019 Does not meet Enhanced MTC farebox MTC extends ramp-up schedule Governor signs requirement period to 2019 Regional Measure 3 authorization Submits Corrective Action WETA Strategic Plan calls Plan with increased for doubling of service in marketing, schedule South San Francisco adjustments
South San Francisco Development Pipeline UNDER CONSTRUCTION Project Description Developer The Cove at Oyster Point 884,300 s.f. R&D, Office HCP Oyster Point III LLC 220-room Hotel 2.5 million square 20,000 s.f. Retail feet of Office, R&D Genentech B-40 160,000 s.f. Office Genentech space currently Gateway of the Pacific 451,485 s.f. Office, R&D Biomed Realty Trust under construction Genesis South San Francisco North Tower 400,000 s.f. Office, R&D Phase 3 Real Estate Partners Merck Campus 281,670 s.f. Office, R&D Alexandria Real Estate Equities 475 Eccles Blvd. Campus 262,287 s.f. Office, R&D Biomed Realty Trust, Blackstone Group Source: SF Business Times, October 2017 APPROVED Project Description Developer 6.3 million square feet Genentech Master Plan 2,600,000 s.f. Office, R&D Genentech of Office, R&D space Landing at Oyster Point, Phases 1 & 2 1,600,000 s.f. Office, R&D Greenland USA/Kilroy Realty approved for Balance of Gateway of the Pacific 1,200,000 s.f. Office, R&D Biomed Realty Trust, Blackstone Group development 249-279 East Grand Avenue 540,000 s.f. Office, R&D Alexandria Real Estate Equities 494 Forbes Blvd. 326,000 Office, R&D HCP Campuses Source: SF Business Times, October 2017
May 2018 San Francisco Bay Area Water Emergency Transportation Authority Strategic Plan
Project Origin Feasibility Studies Project MOU Environmental & Preliminary Design WETA Project Permitting/Design Implementation Timeline Vessel Procurement Construction Begin Operations 9
Project Origin Feasibility Studies Project MOU Environmental & Preliminary Design Demand • Ridership & Fare Revenue estimates Permitting/Design Capital • Waterside, Landside facilities Vessel • Environmental, permitting evaluation Procurement • Conceptual Design Cost Construction Estimates • Capital costs: terminal & vessels • 10-year operating costs Begin Operations 10
System Expansion Components (2015) • Defines WETA service • Establishes minimum requirements Policy Statements • Maintains service quality • Creates quantitative standards • Range of measures Evaluation Measures • No passing/failing grade! • Parking, Pedestrian, Bicycle, Land Use Terminal Access • Area of local partner jurisdiction Policies & Guidelines • No magic formula 11
Expansion Policy – Quantitative Metrics (2015) 3) Farebox Recovery Target Maximum Minimum 100% 50% - 70% 40% 4) Peak Hour Occupancy Target Maximum Minimum 80% 60% - 75% 50% 12
Expansion Quantitative Metrics (2015) Farebox Recovery Farebox recovery is defined as the portion of operating expenses covered by fare revenues. Farebox recovery measures ridership, operating expense and financial sustainability. Maximum Target Minimum 13
Expansion Quantitative Metrics (2015) Peak Hour Occupancy Defined as the combined peak direction occupancy level during the highest ridership hour of a commute service – indicates ridership demand and provides guidance for vessel deployment and service planning. High levels of peak hour occupancy indicate the possibility of leave-behinds or standees and would require corrective action. Maximum Target Minimum 14
South San Francisco Ferry Service Status Report May 2018
Recommend
More recommend