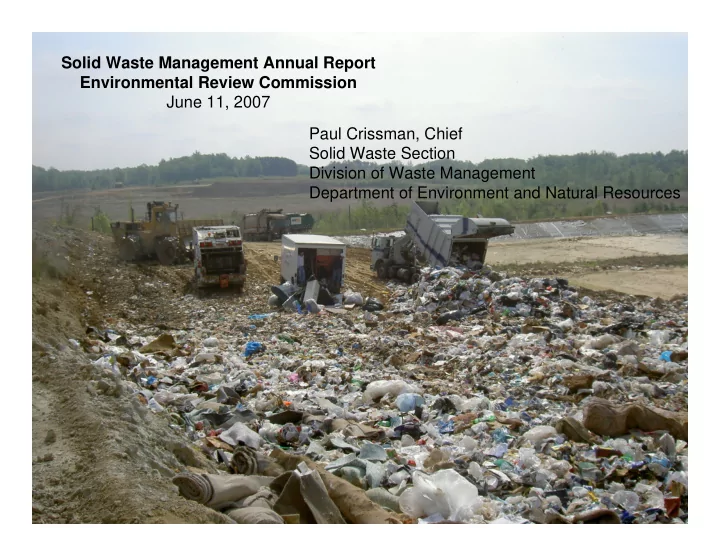

Solid Waste Management Annual Report Environmental Review Commission June 11, 2007 Paul Crissman, Chief Solid Waste Section Division of Waste Management Department of Environment and Natural Resources
Tons of Solid W aste D isposed of by N orth C arolina 12,000,000 10,000,000 8,000,000 Tons 6,000,000 4,000,000 2,000,000 0 1 2 2 3 4 5 6 7 7 8 9 0 0 1 2 3 4 5 6 9 9 9 9 9 9 9 9 9 9 9 0 0 0 0 0 0 0 0 - - - - - - - - - - - - - - - - - - - 0 1 1 2 3 4 5 6 6 7 8 9 9 0 1 2 3 4 5 9 9 9 9 9 9 9 9 9 9 9 9 9 0 0 0 0 0 0 9 9 9 9 9 9 9 9 9 9 9 9 9 0 0 0 0 0 0 1 1 1 1 1 1 1 1 1 1 1 1 1 2 2 2 2 2 2 Fisca l Ye a r
North Carolina Solid Waste Disposal 20-Year Forecast Straight line Population and Straight line Disposal 20,000,000 18,098,667 ACTUAL FORECAST 1.58 per capita 18,000,000 2015 16,000,000 14,447,527 1.45 per capita 14,000,000 11,710,026 Population / Tons Disposed 1.36 per capita 12,000,000 T O N S D I S P O S E D 11,476,456 10,000,000 9,958,773 7,161,455 8,000,000 8,663,914 6,000,000 6,632,448 4,000,000 P O P U L A T I O N 2,000,000 0 1991 1992 1993 1994 1995 1996 1997 1998 1999 2000 2001 2002 2003 2004 2005 2006 2007 2008 2009 2010 2011 2012 2013 2014 2015 2016 2017 2018 2019 2020 2021 2022 2023 2024 2025 2026
A ctual Im ports / Exports 1,400,000 1,200,000 1,000,000 800,000 Tons 600,000 400,000 200,000 0 FY 1997- FY 1998- FY1999- FY 2000- FY 2001- FY 2002- FY 2003- FY 2004- FY 2005- 1998 1999 2000 2001 2002 2003 2004 2005 2006 87,393 74,185 41,840 21,614 117,981 144,116 108,803 119,202 137,307 Im ports 629,415 1,166,875 1,106,897 900,743 882,247 971,286 1,048,111 1,161,926 1,234,307 Exports Fiscal Year
State-wide Municipal Solid 40 MSW Landfills currently operating 40 MSW Landfills currently operating Average facility size: 316.92 acres Average facility size: 316.92 acres Waste Landfills (MSWLF) Average waste footprint: 76.48 acres Average waste footprint: 76.48 acres Average “tip” fee: $33.89 Average “tip” fee: $33.89 Average utilization factor: 0.58 tons/cubic yard Average utilization factor: 0.58 tons/cubic yard Average years in operation: 10.15 years Average years in operation: 10.15 years Average FY2005-2006 Total MSW Disposed (tons) 6,608,556.96 7,910,640.27 67,076,853.11 Used Permitted Planned Volume (yd 3 ) 110,647,868.6 143,447,772 372,022,542 Remaining Volume 32,799,903.4 261,374,673.4 Remaining Capacity 19,023,943.97 151,597,310.6 Tons of Waste 2.89 22.94 Years (average) 2.40 19.16 Years (FY05-06)
Forecast Imports / Exports 4,000,000 3,500,000 3,000,000 2,500,000 Tons 2,000,000 1,500,000 1,000,000 500,000 0 FY 1997- FY 1998- FY 2000- FY 2001- FY 2002- FY 2003- FY 2004- FY 2005- FY1999-2000 Proposed 1998 1999 2001 2002 2003 2004 2005 2006 Imports 87,393 74,185 41,840 21,614 117,981 144,116 108,803 119,202 137,307 4,000,000 629,415 1,166,875 1,106,897 900,743 882,247 971,286 1,048,111 1,161,926 1,234,307 Exports Fiscal Year
North Wake MSW Landfill Borrow pit Working face Leachate lagoon Closed cell
Clay County, 1988
STATUS OF MSWLFS IN NORTH CAROLINA 160 140 130 122 122 120 112 100 UNLINED MSWLFS 80 LINED MSWLFS 60 49 47 43 41 40 40 40 40 40 39 39 40 35 23 22 21 19 20 6 6 6 SUB 'D' EFFECTIVE 3 0 10/9/93 0 1990 1991 1992 1993 1994 1995 1996 1997 1998 1999 2000 2001 2002 2003 2004 2005
State lined landfill requirements (the 98 rule) Federal Sub-title D Landfill requirements (RCRA)
Solid Waste Management Act of 1989 Established: garbage barge from New York City Reporting requirements Planning requirements Landfill bans New programs Set goals and policies
Clay County, 2005
Summary Issue Identification • Increasing amount of waste • Use of new/different facilities • State regulatory staffing reductions • Mobility of waste/inter-state movement • Large in-state regional facilities • Landfill ownership transfer • Capacity (distribution & lack of acceptance) • New landfills proposed for primarily out-of state waste • Landfills proposed in areas not previously anticipated • Legacy of old landfills
Proposed legislation for 2007 1. Strengthen financial/environmental qualifications review 2. Strengthen financial assurance associated with landfill ownership 3. Clarify landfill owner definition and ownership transfer notification 4. Strengthen state enforcement measures 5. Improve/strengthen landfill requirements for the next generation of landfills 6. Improve/strengthen performance of current landfills 7. Require environmental studies for large facilities 8. Fund state regulatory staff expansion through permit fee 9. Fund clean up of orphan landfills through fee on solid waste disposal *Landfill requirements based on: experience in North Carolina, new technologies, need to provide improved protections to the public
Solid Waste in North Carolina The Future: More of the Same (Probably continue to have more and more waste) Yet Very Different (Probably become one of the nation’s leading importers of waste)
Paul Crissman Solid Waste Section Division of Waste Management Department of Environment and Natural Resources 919.508.8497 Paul.Crissman@ncmail.net www.wastenotnc.org
Recommend
More recommend