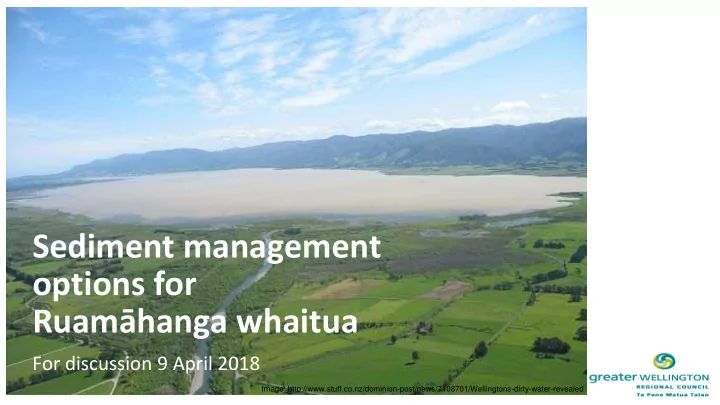

Sediment management options for Ruamāhanga whaitua For discussion 9 April 2018 Image: http://www.stuff.co.nz/dominion-post/news/7108701/Wellingtons-dirty-water-revealed
What do we know? • Sediment impacts: – Aquatic plant growth – Fish health – Macroinvertebrate community health – Recreation, cultural and social values • In our rivers, streams and lakes
What do we know? Baseline - % loss from Baseline - annual loss (T/yr) Non-native land Native land All land Non-native land Native land All land Gully 1% 1% 1% Gully 6610 4123 10733 Landslide 60% 12% 45% Landslide 540720 51144 591864 Surficial 12% 76% 33% Surficial 112394 321480 433874 Earthflow 2% 0% 1% Earthflow 14459 84 14543 Netbank 227435 45613 273048 Netbank 25% 11% 21% Total hill slope 674183 376831 1051014 Total hill slope 75% 89% 79% Total erosion 901618 422444 1324062 • 79% hill slope erosion, 21% netbank erosion • 68% from non-native land, 32% from native
What do we know? ~41% ~66%
What might the future hold? Reductions in load from baseline (T/yr) BAU2080 Retirement/ Stock exclusion + Constructed Pole planting afforestation planting wetlands Per mitigation 407 152663 181948 0 Total 335019 % of Total 0.1% 45.6% 54.3% 0.0% Reductions in load from baseline (T/yr) SILVER2080 Retirement/ Stock exclusion + Constructed Pole planting afforestation planting wetlands Per mitigation 110075 265228 181948 51672 Total 608924 % of Total 18.1% 43.6% 29.9% 8.5%
What might the future hold? Baseline BAU2080 SILVER2080 Annual Ruamāhanga load (T/year) 1324062 988814 715726 Total annual 'non-native' load (T/year) 901619 579999 333859 Total annual 'native' load (T/year) 422443 408815 381867 % annual 'non-native' load 68 59 47 % annual 'native' load 32 41 53
Possible objectives and policy approach • Numeric objectives reflecting desired state – Requires suitable data and relationships to be known between contaminant loss and water quality outcome – Currently very hard for sediment in the Ruamāhanga • Change in load target based on what’s feasible – Still driven by impacts on values – Co-benefits with other freshwater objectives – SedNetNZ analysis ids issues and opportunities • Note on allocation
Suggested policy approach for discussion • Two key drives – increase effort to: – Reduce stream bank erosion across whaitua – Reduce hill erosion in ‘top 5’ FMUs • Sediment load targets for all FMUs • GMP for high risk activities • Improve monitoring and information • Sub- catchment planning and work prioritisation in ‘top 5’ • Extensive riparian programme
Reducing sediment in the ‘top 5’ – how much and by when? Total loads (T/yr) per FMU from non-native land uses 10% 20% 50% 100% FMU name Baseline BAU2080 SILVER2080 SILVER2080 SILVER2080 SILVER2080 Taueru 229931 143803 136167 128531 105622 76363 Huangarua 144136 98439 93810 89181 75293 46292 Eastern hill streams 85169 57728 55100 52471 44586 26285 Whangaehu 71510 50271 47795 45318 37889 24765 Kopuaranga 67149 60274 56935 53596 43579 33390 TOTAL OF 5 FMUs 597895 410516 389806 369097 306969 207095 % reduction from Baseline non-native load in ‘top 5 ’ FMUs -31% -35% -38% -49% -65% Comparative loss from native 10% 20% 50% 100% Baseline BAU2080 to non-native land (entire SILVER2080 SILVER2080 SILVER2080 SILVER2080 whaitua) Native 32% 41% 43% 44% 47% 53% Non-native 68% 59% 57% 56% 53% 47%
Recommend
More recommend