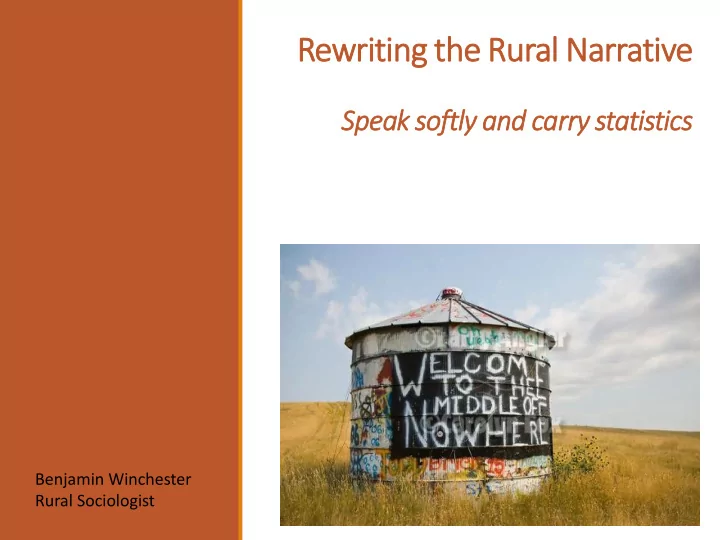

Rewriting the Rural Narrative Speak softly and carry statistics Benjamin Winchester Rural Sociologist
The narrative • There’s a brain drain • We live in the middle of nowhere • We are a sleepy town • Everyone knows one another • Nobody lock their doors • What we had • What we don’t have • What we wish we had • What we could have had…
No More Anecdata! anecdata (noun). information which is presented as if it is based on serious research but is in fact based on what someone thinks is true
Mechanization of agriculture Roads & transportation Main street restructuring School consolidations
Rural is Changing, not Dying Small towns are microcosms of globalization ◦ Many of these changes impact rural and urban areas alike (not distinctly rural) yet are more apparent in rural places Survived massive restructuring of social and economic life (with volunteer leadership) Research base does NOT support notion that if XXXX closes, the town dies
Rural Rebound Since 1970, rural population increased by 11% ◦ Relative percentage living rural decreased 19% 26% 203,211,926 308,745,538 (53.6m rural) (59.5m rural)
Total Population In Infa fatuation 2000-2010
Total Population In Infa fatuation Wait it, what?
Stability , not stagnation or sinkholes. Pop Occ HU Change Change -15% -2% Carter -1% 3% Dawson -6% 0% Garfield -11% -3% Judith Basin -8% -2% Phillips 1% 7% Richland -2% 3% Rosebud -1% 3% Silver Bow 4% 4% Wheatland 2000-2010 U.S. Census Bureau
Avg HH Size: 1940: 3.6 2018: 2.6 (-29%) Kids graduate Population: -2 Households: NC Spouse passes Population: -1 Households: NC
Myth: Only the “lucky few” escape rural America Roughly 49 % of Montana residents move every 5 years.
?? Brain Drain
The Rural Brain Gain They choose rural age 30-49 And also when they are 50-64 (since the 1970s)
Newcomers: Why? Simpler pace of life Safety and Security Low Housing Cost
Percent Move Factors Take advantage of the slower pace of life 71 with Preference To live closer to relatives 70 Proportion of households that To find a less congested place to live 69 indicated it was important in some way. To live among people with similar values 68 To find lower priced housing 67 To find a safer place to live 67 To live in a smaller community 66 To find a lower cost of living 65 To find a good environment for raising children 65 To find a job that allowed a better work-life balance 61 To find a job that matches my skills 60 To take on a new job 58 To find a higher paying job 56 To live closer to friends 50 To find higher quality schools 49
Workforce Newcomers 2020: Who? • 31% moved for a job • 25% lived there previously • 60% attain bachelors degree • 75% household incomes over $50k • 47% have children in household • 82% own their home • 54% commute 10 minutes or less
Question: Do you typically telecommute or work remotely for a company not located in your region? (of those in workforce) Respondent 14% Spouse 16% 18% currently own a business (14% not a farm). Already existed 36% Created it 65% 10% currently own a farm. Already existed 70% Created it 30%
Cohort Lifecycle Avg. American moves 11.7 times in lifetime (6 times at age 30)
Choosing Rural Brain Gain: migration to rural age 30-49 ◦ Also 50-64 but not as widespread ◦ Brain drain is the rule, not the exception ◦ Happening since the 1970s Newcomers look at 3-5 communities ◦ Topical reasoning (local foods regions) ◦ Assets vary by demographic Employee recruitment must get past “warm body” syndrome
Diversifying the rural economy
MYTH: Social life is dying… First question: How many people do we need to run our town? We have numerous leadership programs currently training leader supply , but are we keeping up with the organization demand ?
Nonprofit Change: 2000-2010 +33%
Social Life is Not Dyin ing Nonprofit Growth: 2000-2010
1976 1990 1968 2007 2013 1996
Population per Organizational Role, 2010 2 nd highest demand for leaders in U.S. 1 in 22 people must LEAD* * Assumes 3 people per new group
Population per Organizational Role, 2000 - 2010 1 in 22 people must LEAD* 794 new leaders per year * Assumes 3 people per new group
SH SHIF IFT in in Engagement Narrow geography Broad focus Action: consensus Broad geography Narrow focus Action: the small
20% live rural/small town 51% would PREFER to MOVING IN : Demand for rural and small town living! Source: “For Nearly Half of America, Grass is Greener Somewhere Else”. Pew Research Center, 2009.
Negative Narratives Would we allow this negative language to permeate a product or service we were selling? Why do we do it? Cannot continue to portray rural success as the exception
resident recruitment Community Development Economic Development Tourism
The Rural Choice These newcomers are: • Diversifying social life • Creating groups, building their community • Diversifying the economy • Buying/starting businesses, working from home • Living in a region (no longer a 1-stop-shop) • More than warm bodies (employee recruitment)
The Rural Choice: Opening New Doors and Welcoming New Neighbors The bottom line is people WANT to live and move here for what you are today and will be tomorrow , not what may have been! Rural Revitalization is Upon Us!
Brain Gain Landing Page Reddit: Rural By Choice http://z.umn.edu/braingain/ /r/ruralbychoice Twitter: @grokrural benw@umn.edu
Recommend
More recommend