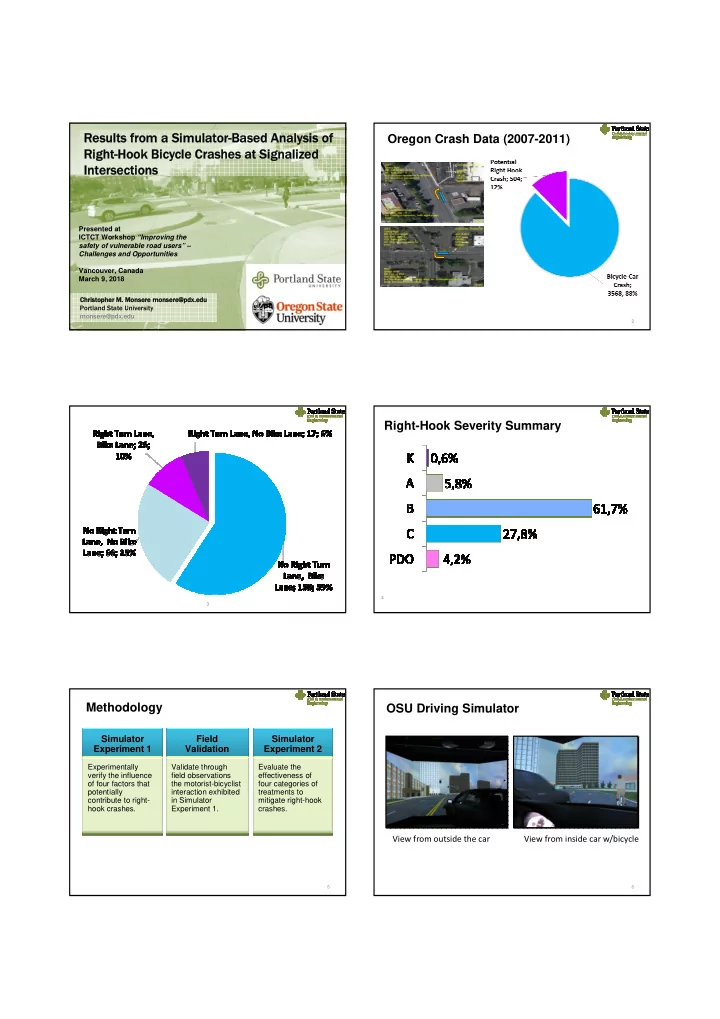

Results from a Simulator-Based Analysis of Oregon Crash Data (2007-2011) Right-Hook Bicycle Crashes at Signalized Intersections Presented at ICTCT Workshop “Improving the safety of vulnerable road users” – Challenges and Opportunities Vancouver, Canada March 9, 2018 Chr hristophe her M. Mons nsere monsere@pdx.edu Portland State University monsere@pdx.edu 1 2 Right-Hook Severity Summary 4 3 Methodology OSU Driving Simulator Simulator Field Simulator Experiment 1 Validation Experiment 2 Experimentally Validate through Evaluate the verify the influence field observations effectiveness of of four factors that the motorist-bicyclist four categories of potentially interaction exhibited treatments to contribute to right- in Simulator mitigate right-hook hook crashes. Experiment 1. crashes. View from outside the car View from inside car w/bicycle 5 6
Simulator Experiment 1 – Variables Simulator Experiment 1 – Design Name of the Variable Levels • 67 Participants None • 16 Simulator Sickness One (1) bicyclist riding in front of the • 51 Usable motorist in an adjacent bicycle lane to the • 1,071 total-right turn scenarios Relative position of bicyclist right One (1) bicyclist coming from behind the motorist in an adjacent bicycle lane to the • Visual attention right • Fixations (eye tracker) Lower (12 mph, 19 kph) Speed of bicyclist • Situational awareness Higher (16 mph, 26 kph) • SAGAT responses None Presence of oncoming vehicular • Crash avoidance traffic Three (3) vehicles • Position and speed of None vehicles, bicycles, and Presence of conflicting pedestrian One (1) pedestrian walking towards the pedestrians motorist 8 Visual Attention – Avg. Total Fixation Visual Attention Frequency Bicyclist position Areas of of fixation Ahead Behind Total (n) 328 328 Fixated 284 145 Interest % 87% 44% (AOIs) 9 10 Field Validation Situational Awareness Mean percentage of correct responses • November 5, 2014 to February 12, 2015 • All days of week • 144 hours • Extraction of 43 events with measured PET < 5 seconds 11
Comparison of Field and Simulator Simulator Experiment 2 – Design • 46 Participants • 18 Simulator Sickness • 28 Usable • 616 total-right turn scenarios • Visual attention • Fixations (eye tracker) • Crash avoidance The most complex driver • Time-to-collision loading (bicycles approaching from behind at • Crash severity • Speed of turning vehicles higher speeds) Simulator Experiment 2 - Variables Average Total Fixation Durations ODOT OR10-15b Dashed white bike Dashed white bike Dashed green bike Full green bike lane “Turning Vehicles line with stencil, lanes with white with dashed white Yield to Bicycles” line with stencil, double line outline outline single line PROTECTED INTERSECTIONS Larger curb radii, 30ft Smaller curb radii, 10ft With islands With islands and green pavement markings 15 16 Simulator Experiment 2- Crash Avoidance Simulator Experiment 2- Crash Severity 10 ft (3 m) 30 ft (9 m) Curb Radius Treatment 17 18
Final Comparison Final Comparison • Each treatment was evaluated based on the following: – Visual attention • Measurable change in longer AFTD towards bicycle targets – Crash avoidance • Frequency of low and moderate TTC observations – Crash severity • Speed of turning vehicles and variance of speed 19 20 Recommendations Acknowledgements • Co-PI: David Hurwitz, Associate Professor, OSU • PhD Student: – Mafruhatul Jannat, PhD ’15, OSU ODOT OR10-15b Dashed white bike Dashed white bike Dashed green bike Full green bike lane “Turning Vehicles • MS Students: line with stencil, lanes with white with dashed white Yield to Bicycles” line with stencil, double line outline outline single line – Ali Razmpa, MS ’15, PSU PROTECTED INTERSECTIONS – Jennifer Warner, MS ’15, OSU • Undergraduate Research Assistants: – Amy Wyman, UHC OSU – Kayla Fleskes, BSCE OSU – Katie Mannion, BSCE OSU – Amber Meeks, BSCE OSU Larger curb radii, 30ft Smaller curb radii, 10ft With islands With islands and green pavement markings 21 Questions? Reports / Papers David Hurwitz, PhD • Warner, J, Hurwitz, D., Monsere, C., Fleskes, K. “ A Simulator- Associate Professor Based Analysis of Engineering Treatments for Right-Hook Oregon State University Bicycle Crashes at Signalized Intersections ” Accident Analysis & Email: david.hurwitz@oregonstate.edu Prevention, 2017 https://doi.org/10.1016/j.aap.2017.04.021 • Jannat, M., Hurwitz, D., Monsere, C. Funk, K. “ The Role of Driver’s Situational Awareness on Right Hook Bicycle-Motor Vehicle Crashes ”. In revision, Safety Science, March 2018 and • Jannat, M., Monsere, C., Hurwitz, D. “ Measuring Driver’s Visual Attention in Right-Hook Crashes Scenarios ” In review, Chris Monsere, PhD, PE Transportation Part F, Submitted February 2018 Department Chair and Associate Professor Portland State University • Hurwitz, D., Monsere, C., Jannat, M., Warner, J, Razmpa, A. Email: monsere@pdx.edu “ Towards Effective Design Treatment For Right Turns At Intersections With Bicycle Traffic ”. Oregon Department of Transportation SPR Project No. 767, June 2015 (link) 23 24
Recommend
More recommend