
Resolving the Extragalactic γ -ray Background Marco Ajello Ackermann+2015, ApJ, 799, 86 Clemson University Ajello+2015, ApJL, 800,27 Ackermann+2016, PRL, 116, 151105 On behalf of the Fermi-LAT collab. Singal 2015, MNRAS, 115,112 (with a few additions by Jack) Singal+2014, ApJ, 786,109 Singal+2012, ApJ, 753, 45
Fermi : Bigger, Sharper, Faster Large Area Telescope (LAT): • 100 MeV - > >500 GeV • 2.4 sr FoV (scans entire sky every ~3hrs) Gamma-ray Burst Monitor (GBM) • 8 keV - 40 MeV • views entire unocculted sky
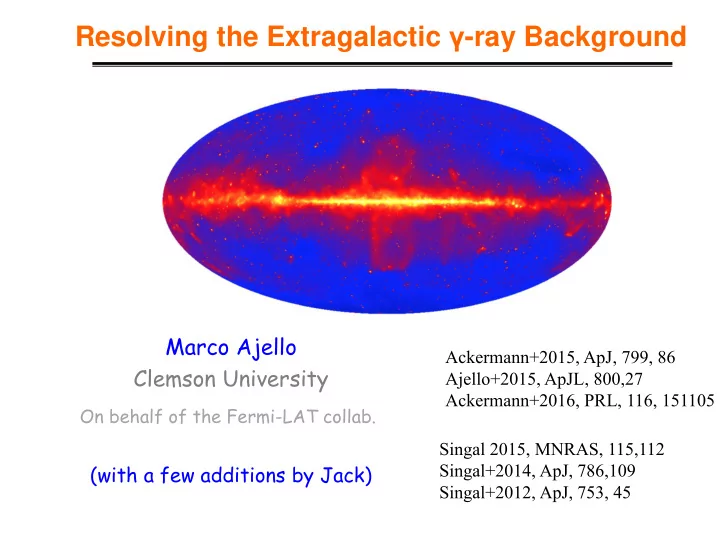
The Gamma-ray Sky as Seen by Fermi ~10% Nearly isotropic all-sky component ( includes residual cosmic-ray background ) ~10% ~80% Galactic emission is 2 body process so very highly concentrated in plane Suppressed in halo
20 deg wide patch 1 year, > 1 GeV 4
20 deg wide patch 5 years, > 1 GeV 5
Total Extragalactic Gamma-ray Background Systematic uncertainty from Galactic foreground represented by yellow band Ackermann et al. 2015
EGB: Why is it important ? Undetected sources Diffuse processes • sa üc Intergalactic shocks Blazars Widely varying predictions of Dominant class of LAT extra- EGB contribution ranging from galactic sources. Many estima- 1% to 100% (e.g. Loeb & Waxman tes in literature. EGB contribu- 2000, Gabici & Blasi 2003) tion ranging from 20% - 100%. Markevitch Dark matter annihilation Non-blazar active galaxies Potential signal dependent on 27 sources resolved in 2FGL nature of DM, cross-section and üc ~ 25% contribution of radio structure of DM distribution galaxies to EGB expected. (e.g. (e.g. Ullio et al. 2002) Inoue 2011) Interactions of UHE cosmic Star-forming galaxies rays with the EBL Several galaxies outside the Dependent on evolution of CR local group resolved by LAT. sources, predictions varying from Signi fica nt contribution to EGB 1% to 100 % (e.g. Kalashev et al. 2009) expected. (e.g. Pavlidou & Fields, 2002, Ackermann et al. 2012) Extremely large Galactic GRBs üc electron halo (Keshet et al. 2004) High-latitude pulsars CR interaction in small solar Small contributions expected. bodies (e.g. Dermer 2007, Siegal-Gaskins et al. system bodys (Moskalenko & Porter 2010) 2009)
Blazars Blazars contribute a grand-total of (5-7) × 10 -6 ph cm -2 s -1 sr -1 • 1. Blazars produce ~50% of the EGB 2. Blazars + EBL are responsible for the cut-off of the EGB spectrum Ajello+15
Blazars (JS) • Ways to calculate 1. Use blazar source counts Advantage: straightforward to determine at fluxes observed Disadvantage: Unknown below flux cutoff Flux cutoff is photon energy dependent 2. Use blazar luminosity functions Advantage: more straightforward to extrapolate Lum fn. down than source counts Disadvantage: more complicated integration to get total
Blazars (JS) • Ways to calculate 1. Use blazar source counts EGRB FSRQs BL Lacs Singal, 2015, MNRAS , 115, 112 100 Mev-100 GeV FSRQs % BL Lacs % Total % Probed 20 10 30 Extrapolated 35 (+35/-9) 17 (+44/-12) 52 (+all/-15)
Blazars (JS) • Ways to calculate ' L , z z L g z 2. Use blazar luminosity functions L L L Singal, Ko, & Petrosian, 2014, ApJ , 786, 109 FOR FSRQs z=0 “local” lum. fn. (stars) z=1 lum. fn. (stars) with Ajello et al. (2012, ApJ , 751, 108) (lines) with Ajello et al. and Inoue et al. (2012, ApJ , 751, 108) (lines) (2010, PASJ , 62, 1005) (dash-dot) Here FSRQs in toto account for 22( +10 / -4 )% of the EGB in 100 Mev- 100 GeV
Blazars (JS) • How did we calculate the source counts or luminosity function? Lynden-Bell method modified with the use of associated sets for truncated data ' L , z z L g z L L L 1 L ' 1 k n k k Cumulative lum. fn. Determined by modified Lynden-Bell (1971, MNRAS , 155, 95) modified with associated sets (e.g. Singal et al., 2012, ApJ , 764, 43)
Blazars Blazars contribute a grand-total of (5-7) × 10 -6 ph cm -2 s -1 sr -1 • 1. Blazars produce ~50% of the EGB 2. Blazars + EBL are responsible for the cut-off of the EGB spectrum Ajello+15
Star forming galaxies • as Milky Way LMC SMC M 31 M 82 NGC 253 NGC 1068 NGC 4945 > 8 galaxies detected by the LAT > Almost linear correlation between gamma-ray luminosity and tracers of star formation ▪ bolometric infrared luminosity ▪ 1.4 GHz radio continuum emission > Detection + upper limits can be used to constrain correlation > Use gamma-ray / IR luminosity correlation to calculate EGB contribution based on IR luminosity function of galaxies. Ackermann et al., ApJ 755, 164, 2012 LAT detects all famous C-Thick AGN Markus Ackermann | Fermi Symposium, Monterey | 11/01/2012 | Page 30 14 Marco Ajello
Star forming Galaxies Ackermann+12, ApJ, 755, 164 • Star-forming galaxies contribute 13%( ± 9%) of the EGB 15 Marco Ajello
Radio Galaxies Di Mauro, Ajello+14 • Fermi has detected 15 radio galaxies (Abdo+10, ApJ 720, 912 and Nolan+12, ApJS, 199, 31) • A correlation exists between the g-ray and the core luminosity • Using the Willott+01 Luminosity Function, the contribution to the IGRB is: 25% (+58%/-16%) 16 Marco Ajello
Dark Matter Limits • DM limits reach higher masses due to the high-energy reach (820 GeV) of the EGB measurement • Decreasing the uncertainties on source contributions can improve the limits by a factor of 5 Ajello + 2015
Summing Everything Up Ajello+15
Conclusion • Fermi-LAT – Among the few instruments able to measure and resolve a cosmic background at the same time • EGRB: – It can be explained entirely (between 100 MeV and 800 GeV) by known source populations – Blazars (FSRQs > BL Lacs) > SFGs > Radio Galaxies > DM • EGRB is an important tool in multi-messenger astrophysics 19
Recommend
More recommend