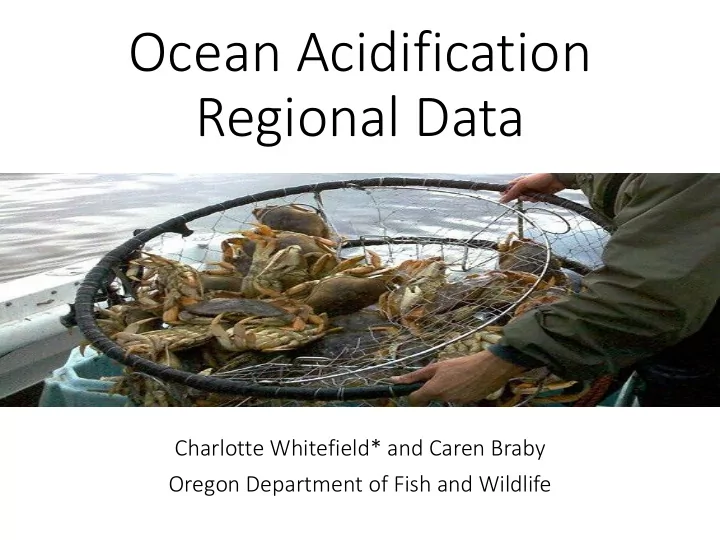

Ocean Acidification Regional Data Charlotte Whitefield* and Caren Braby Oregon Department of Fish and Wildlife
Dungeness Crab Dis istribution Tri-State Dungeness Crab agreement
The Pacific Coast Collaborative (PCC) West Coast OAH Monitoring Inventory Assess the OAH monitoring landscape Physical, Chemical, and Biological Financial/Operational Security Identify the existing OAH monitoring backbone Design of a West Coast integrated monitoring network Gap identification Information synthesis
West Coast OAH Monitoring In Inventory ry 14 3598 line items (points or individual assets) 359 Survey Areas • 208 2085 from state or or fed ederal ag agencies • 136 1369 from ac academic res esearchers • 69 11 11 from trib tribal pr programs Shore-Side • 116 116 from no non-profit or organizations Sensors • 6 from ind 6 ndustry y par partners 27 174 different pr 174 proje ojects Cruises • 94 res 94 esearchers across 93 93 ins nstitutions & Gliders 1798 line items looking at both ph 179 physic ical and bi biological 147 1474 line items focused solely on bi biologic ical rese esearch 150 319 line items focused solely on ph 319 physic ical/chemical l res esearch Moorings 220 assets or projects that are actively recording in situ 220 1631 measurements Cruise Stations 37 assets actively able to inform OAH con 37 onditions 1712 Sample Sites
West Coast OAH Monitoring In Inventory ry
West Coast OAH Monitoring In Inventory ry
In Inshore mooring: : CE06ISSM Gray’s Harbor CE06ISSM Columbia River
Inshore mooring: In : CE06ISSM pH
Inshore mooring: In : CE06ISSM Temperature
Inshore mooring: In : CE06ISSM Salinity
In Inshore mooring: After River Plume Shift Before River Plume Shift : CE06ISSM pH
In Inshore mooring: After River Plume Shift Before River Plume Shift : CE06ISSM pH
In Inshore mooring: : CE06ISSM Classroom Data Set pH Before River Plume Shift 8.6 8.4 8.2 8 7.8 7.6 7.4 7.2 7 0:30:19 12:30:20 0:30:20 12:30:19 0:30:20 12:30:20 0:30:21 12:30:20 0:30:20 12:30:19 0:30:20 12:30:20 11-Oct- 11-Oct- 12-Oct- 12-Oct- 13-Oct- 13-Oct- 14-Oct- 14-Oct- 15-Oct- 15-Oct- 16-Oct- 16-Oct- 2017 2017 2017 2017 2017 2017 2017 2017 2017 2017 2017 2017 pH 8.6 After River Plume Shift 8.4 8.2 8 7.8 7.6 7.4 7.2 7 0:30:19 12:30:21 0:30:20 12:30:19 0:30:19 12:30:21 0:30:18 12:30:20 0:30:22 12:30:19 0:30:20 12:30:21 21-Oct- 21-Oct- 22-Oct- 22-Oct- 23-Oct- 23-Oct- 24-Oct- 24-Oct- 25-Oct- 25-Oct- 26-Oct- 26-Oct- 2017 2017 2017 2017 2017 2017 2017 2017 2017 2017 2017 2017
http://www.sartep.com/chem/chartsandtools/phconvert.cfm In Inshore mooring: : CE06ISSM Classroom Data Set Date Time pH pHround Date Time pH pHround 11-Oct-2017 0:30:19 7.9663 8 21-Oct-2017 0:30:19 7.8516 7.9 11-Oct-2017 12:30:20 7.7851 7.8 21-Oct-2017 12:30:21 7.9033 7.9 12-Oct-2017 0:30:20 7.8795 7.9 22-Oct-2017 0:30:20 7.8568 7.9 12-Oct-2017 12:30:19 7.7217 7.7 22-Oct-2017 12:30:19 7.9372 7.9 13-Oct-2017 0:30:20 8.0066 8 23-Oct-2017 0:30:19 8.1391 8.1 13-Oct-2017 12:30:20 7.6202 7.6 23-Oct-2017 12:30:21 7.7337 7.7 14-Oct-2017 0:30:21 8.0824 8.1 24-Oct-2017 0:30:18 7.9139 7.9 14-Oct-2017 12:30:20 7.6091 7.6 24-Oct-2017 12:30:20 7.6873 7.7 15-Oct-2017 0:30:20 8.2973 8.3 25-Oct-2017 0:30:22 7.8286 7.8 15-Oct-2017 12:30:19 7.7945 7.8 25-Oct-2017 12:30:19 7.7591 7.8 16-Oct-2017 0:30:20 7.6443 7.6 26-Oct-2017 0:30:20 7.6602 7.7 16-Oct-2017 12:30:20 7.84 7.8 26-Oct-2017 12:30:21 7.4461 7.4 Mean 7.853916667 7.85 Mean 7.809741667 7.808333 SD 0.206668148 0.219504 SD 0.172306215 0.172986 Range 7.6091:8.2973 7.6:8.3 Range 7.4461:8.1391 7.4:8.1 http://www.sartep.com/chem/chartsandtools/phconvert.cfm
Potential Cla lassroom Applications “Simple, Local, Positive” Enhancing Mathematical Skills Graphing Skills and Data Interpretation Links to Biology – research the pH stress limits of other species
Supplemental In Information Community Forums https://www.oainfoexchange.org/index.html
Supplemental In Information One page graphics
Supplemental In Information NOAA OA Centers https://oceanacidification.noaa.gov/AboutUs/EducationOutreach/TabId/2994/PID/14968/evl/0/Cate goryID/208/CategoryName/education-outreach/Default.aspx
Supplemental In Information Additional Data Portals https://sos.noaa.gov/datasets/ocean-acidification-surface-ph/ https://www.nodc.noaa.gov/oceanacidification/stewardship/data_portal.html http://nvs.nanoos.org/Explorer?action=overlay:liveocean_temp http://www.nanoos.org/products/j-scope/forecasts.php Stay toned for the release of the PCC West Coast Portal in early 2019 For additional information email: charlotte.m.regulawhitefield@state.or.us
Recommend
More recommend