PUBLIC HEARING: FISCAL YEAR 2015/2016 OPERATING AND CAPITAL BUDGET P resented by: Greg Nyhoff, City Manager J une 16, 2015
KEY MILESTONES TO DATE D ATE M ILE S TONE S Initiated Organizational Assessment S eptember, 2014 Conducted a Community F orum to S olicit Community P riorities March, 2015 F irst P hase of the Internal S ervices Assessment discussed with March, 2015 Council, along with 129 recommendations Obtained Council F eedback on Identified Community P riorities April, 2015 P resented F inancial F orecast and Impact of Major Assessment May, 2015 F indings to Council Conducted Budget Workshops to discuss 5% , 10% , and 15% budget May, 2015 reduction scenarios for Council/Community F eedback P resentation of Budget J une 9, 2015 Town Hall Meeting J une 11, 2015 P ublic Hearing J une 16, 2015 Budget Adoption J une 23, 2015 2
7 KEY POINTS 1. P resent a Balanced Budget; 2. Responsible F iscal S ustainability into the F uture; 3. Reductions Across Departments and P artners; 4. P ublic S afety: • No F ire S tation Closures; • No F irefighter or P olice Officer Layoffs; • Maintain P atrol S taffing Levels; • Maintain P olice E mergency Response Times; 5. S trengthening the F oundation (Human R esources); 6. Master P lan (Water and Wastewater); 7. Complete E nvironmental R esources Transition; 3
FY 2015/2016 BUDGET OVERVIEW FY 2015-16 Proposed Budget (All funds) $359.4M (in Millions) Hous ing Authority $24.8 M S pecial Revenues $28.2M General F und General F und P ublic S afety Carman Override Internal $115.2M S ervices $26.3M Tax Measure O 1/2 cent sales tax E nterprise F unds Internal S ervices F unds E nterpris e F unds $143.5M Carman Override $10.5 M Meas ure O $10.9 4
FY 2015/2016 BUDGET OVERVIEW F Y 15-16 E nterpris e F unds PACC $1.5M $143.5M Golf $5.6M (in Millio n s ) Water Enterprise Wastewater Enterprise ER $42.4M Water $60.7M Environmental Resources Enterprise Golf Course Enterprise Performing Arts and Convention Center Wastewater $33.3M 5
FY 15/16 GENERAL FUND EXPENDITURES FY 15-16 General Fund Expenditures Salary and Benefits .4% Capital Outlay $.5M Operating Expenses 8% Other 9% Internal Service Internal Service Charges $9M Charges $10M One-Time Capital Outlay 10% Operating Other Expenses $11M 72% Salary & Benefits $84M 6
FY 15/16 GENERAL FUND REVENUES Other* $31.6M $46.6M Property Tax TOT $4.3M Business $27.2M License $5.5M Sales Tax *Other includes Service Fees and Charges, Indirect Cost Reimbursement, Franchises, Infrastructure Use, Fine and Forfeitures, Building Fees and Permits, etc. 7
FULL- TIME EQUIVALENT (FTE’S) POSITIONS Adopted F Y 2014-2015 1,277.50 F TE P ositions Revised F Y 2014-2015 1,279.00 F TE P ositions P roposed F Y 2015-2016 1,217.75 F TE P ositions E liminates 61.25 P ositions 8
FY 2015/2016 BUDGET OVERVIEW 1217.75 total FTE’s S taffing Authorized 450 394 400 350 300 250 200 150 130 128 150 116 80 100 47.5 34 50 18 18.15 22.35 24 11.2 12.25 17.3 9 3 3 0 9
LIMITED BENEFIT EMPLOYEES… • Ha ve a long history of contributing to City service levels • Are “at - will” employees meaning they may be terminated without notice or cause, though will be treated with respect and professional courtesy • Will be part of the overall budget deficit solution Human Resources is scheduled to meet with department heads in J uly to: E valuate and determine appropriate use of LBE ’s across city; Determine reduction levels & notification process 10
LIMITED BENEFIT EMPLOYEES BY DEPARTMENT DEPARTMENT LBE Count RECREATION 380 GENERAL SERVICES 101 ENVIRONMENTAL RESOURCES 52 LIBRARY SERVICES 32 POLICE DEPARTMENT 25 HOUSING AUTHORITY 20 WATER OPERATIONS 6 CITY TREASURER 4 DEVELOPMENT SERVICES 4 CITY MANAGER 3 ECONOMIC DEVELOPMENT 2 FIRE DEPARTMENT 2 CITY ATTORNEY 1 CITY CLERK 1 FINANCE DEPARTMENT 1 GRAND TOTAL 634 11
KEY COST DRIVERS Impact on Ongoing Expenses Repayment of Assessment Measure “O” P E R S /P ARS Districts Loan Animal S helter P ACC Operating Golf Debt Contract Deficit Increases Debt S ervice on P oor Budgeting Development Carman Issue P ractices S ervice Center 12
SUBSTANTIAL GROWTH IN PENSION COSTS • P ension costs up five- fold since 2004 • General F und will bear greater share of S afety costs: • Costs exceed override tax rate • Retirement fund reserves depleted • E ligible costs restricted • This is a long-term problem, which is why my recommendation is to have employees help pay their share 13
SUBSTANTIAL GROWTH IN PENSION COSTS Mis c. P E RS P E RS Cos t F orecas t* Public S afety P E RS 25,000,000 $21,768,991 $20,689,875 20,000,000 $16,386,868 $17,017,703 $16,842,946 15,000,000 $11,863,056 10,000,000 5,000,000 - F Y 14-15 F Y 15-16 F Y 16-17 F Y 17-18 F Y 18-19 F Y 19-20 F Y 20-21 F Y 21-22 14 *All Funds (General Fund, Enterprise Funds, Grant Funds, Retirement Tax Fund, Etc.)
GENERAL FUND BALANCE HISTORICAL OVERVIEW & FORECAST If we do nothing….. 8% Min. Reserve 15
GENERAL FUND BALANCE HISTORICAL OVERVIEW & FORECAST With Budget Adjustments….. 8% Min. Reserve 16
GENERAL FUND PROFORMA % Changes FISCAL YEAR 14-15 FISCAL YEAR 14-15 FISCAL YEAR 15-16 FY 14-15 Revised Adopted Revised PROPOSED to 15-16 Proposed Beginning Fund Balance, July 1 10,864,119 10,864,119 12,944,421 19% REVENUES: Property Tax 43,891,000 45,010,294 46,613,567 4% Sales Tax 27,619,000 30,188,731 27,195,810 -10% Other Revenues 41,595,159 40,732,119 41,414,599 2% Loans from Measure O 16,000,000 - -100% TOTAL REVENUES 113,105,159 131,931,144 115,223,976 (0) EXPENSES: City Attorney (1,504,794) (1,510,898) (1,820,181) 20% City Clerk (427,814) (427,482) (442,266) 3% City Council (351,397) (355,122) (350,655) -1% City Manager (1,992,437) (2,579,130) (2,747,644) 7% City Treasurer (1,300,082) (1,353,242) (1,364,180) 1% Development Services (6,681,225) (6,882,206) (6,281,439) -9% Economic Community Development (1,456,269) (1,181,652) (1,397,082) 18% Finance (3,106,223) (3,197,533) (3,301,554) 3% Fire (15,699,560) (16,519,141) (15,393,683) -7% General Services (9,563,186) (9,484,572) (9,471,280) 0% Housing (198,391) (259,824) (397,088) 53% Human Resources (894,844) (1,974,583) (2,039,165) 3% Library (4,359,651) (4,454,940) (4,263,233) -4% Police (50,157,632) (50,119,154) (53,625,848) 7% Recreation (5,544,312) (5,143,145) (4,822,356) -6% Utilities Construction Eng & Adm. (1,134,937) (1,451,358) (571,985) -61% Non-Departmental (7,577,299) (6,508,911) (1,496,846) -77% Transfer Out to Assessement Districts (250,000) (3,119,432) (612,969) -80% Transfer Out to PACC (905,106) (2,758,604) (886,049) -68% Transfer Out to Impact Fees (7,443,600) (511,898) -93% Transfer Out to Golf (3,126,313) (1,066,328) -66% Loan Payment to Measure O - (1,875,688) One-Time Capital Outlay - (484,560) TOTAL EXPENSES (113,105,159) (129,850,842) (115,223,976) -11% NET CHANGE IN FUND BALANCE Ending Fund Balance, June 30 10,864,119 12,944,421 12,944,421 0% % of Fund Balance 10% 10% 11% Mandatory Reserve Level 18% 18% 18% Projected Cash Reserve Over/(Under) Mandatory Reserve -8% -8% -7% 17
PROPOSED BUDGET REDUCTIONS F Y 2015-16 P ropos ed B udg et Reductions (Millions ) E liminating Vacant P ositions $4.2 S ervice Reductions $4.4 Capital Outlay Increase ($0.5) E fficiency S avings $0.6 P roposed E mployee Concessions $4.0 Net Budget Corrections $12.8 18
PROPOSED REDUCTIONS BY DEPARTMENT G u idin g P rin c iples an d T h emes P rioritize S ervices and Minimize S ervice Reductions to the P ublic P ublic S afety is a T op P riority Ongoing Revenues = Ongoing E xpenditures Identify E fficiency S a vings Cost S a vings Must Be Real T ough Decisions Must be Made Respect Our E mployees 19
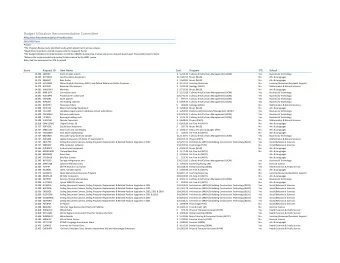
SUMMARY OF PROPOSED INCREASES/REDUCTIONS D E NT / P D P D P NT P AR TME R OP OS E R OP OS E E R CE P AM I NCR R DUCTION C HANGE R DUCTION R OGR E AS E S E S E Carnegie Art Museum - ($ 40,469) ($ 40,469) -10% City Attorney $253,800 ($ 141,712) $ 112,088 6.16% City Clerk - ($ 7,989) ($ 7,989) -1.81% City Manager’s Office $368,570 ($ 429,153) ($ 60,583) -2.20% City Treasurer $ 80,000 ($ 98,640) ($ 18,640) -1.37% Convention and Visitors Bureau - ($ 70,000) ($ 70,000) -10% Development S ervices $202,500 ($ 590,000) ($ 387,500) -6.17% E conomic Community Development $ 5,000 - $ 5,000 .36% F ire $419,000 ($1,510,960) ($1,091,960) -7.09% General S ervices - ($ 672,382) ($ 672,382) -7.10% Human Resources $486,954 ($ 14,723) $ 472,231 23.16% Library - ($ 259,098) ($ 259,098) -6.08% Non-Departmental - ($ 120,000) ($ 120,000) -10.91% P erforming Art Center Contribution - ($ 172,898) ($ 172,898) -19.51% P olice $1,356,685 ($2,508,655) ($1,151,970) -2.15% Recreation & Community S ervices - ($ 981,597) ($ 981,597) -20.36% General F und Total (+/-) $3,172,509 ($7,626,276) ($4,453,767) 20
Recommend
More recommend
Unleash a World of Digital Possibilities—Browse, Share, and Explore Content Without Boundaries