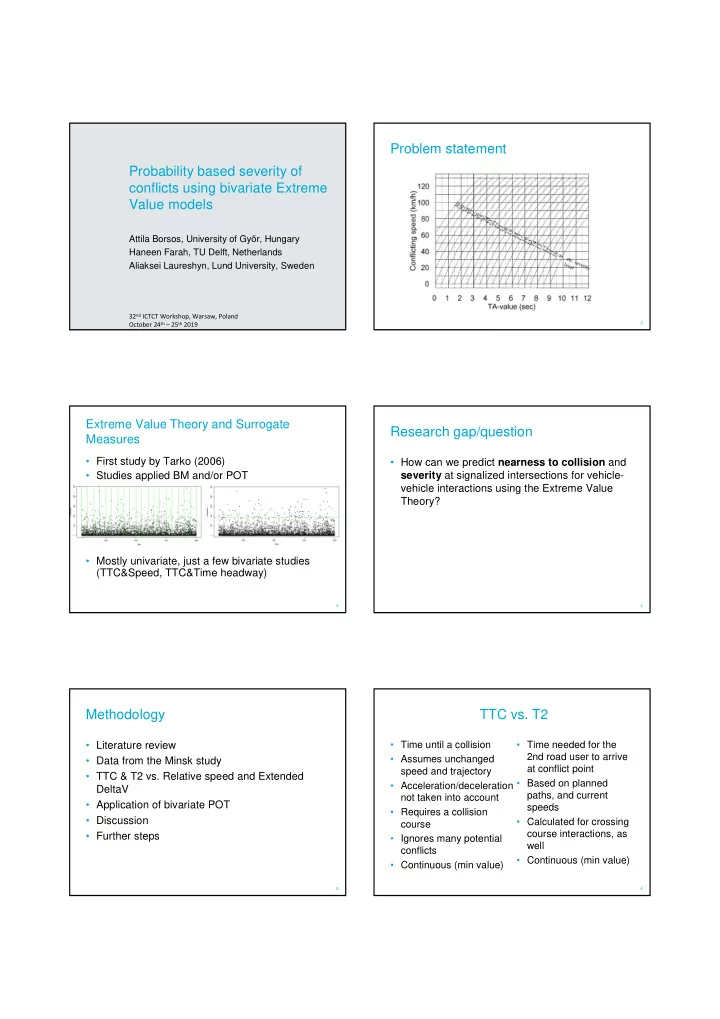

Problem statement Probability based severity of conflicts using bivariate Extreme Value models Attila Borsos, University of Gy ő r, Hungary Haneen Farah, TU Delft, Netherlands Aliaksei Laureshyn, Lund University, Sweden 32 nd ICTCT Workshop, Warsaw, Poland October 24 th – 25 th 2019 2 Extreme Value Theory and Surrogate Research gap/question Measures • First study by Tarko (2006) • How can we predict nearness to collision and • Studies applied BM and/or POT severity at signalized intersections for vehicle- vehicle interactions using the Extreme Value Theory? • Mostly univariate, just a few bivariate studies (TTC&Speed, TTC&Time headway) 3 4 Methodology TTC vs. T2 • Time until a collision • Time needed for the • Literature review 2nd road user to arrive • Assumes unchanged • Data from the Minsk study at conflict point speed and trajectory • TTC & T2 vs. Relative speed and Extended • Based on planned • Acceleration/deceleration DeltaV paths, and current not taken into account • Application of bivariate POT speeds • Requires a collision • Discussion • Calculated for crossing course course interactions, as • Further steps • Ignores many potential well conflicts • Continuous (min value) • Continuous (min value) 5 6
Relative speed / Extended DeltaV Case • speed of a moving • change of the velocity • Two-phase signalized intersection in Minsk vehicle relative to vector by a road user • 32 PDO crashes (5 straight-left turn) 1999-2009 another moving vehicle during a crash • Recordings for 2 days (6AM – 9PM) • takes into account • takes into account • Straight moving – left turning interactions speeds only vehicle masses, • Subsets for indicators speeds and angle • highest of the two is – TTC: n=193 used – T2: n=789 7 8 CDFs Severity vs. probability based risk levels Relative speed or Severity levels Severity levels Delta-V0 (m/s) R 1,1 R 0,1 R 0,1 R 1,1 u 2 R 1,0 R 0,0 R 1,0 R 0,0 0 u 1 TTC min or T 2min (s) 9 10 Modeling – focusing on R 1,1 Bivariate POT Modeling Modeling dependence and dependence and Threshold selection marginal marginal Marginal distributions (spectral measure plot distributions distributions + univariate POT plots) simultaneously separately •excesses above threshold (u) have a Generalized Bivariate GPD with Copula logistic distribution (entire range of data + Pareto Distribution (GPD) with two parameters, the (other distr.s tested) univariate POT) shape � and the scale � parameters Risk levels Risk levels Dependence (parametric – logistic) •dependence parameter ( α ) 11 12
Dependence Bivariate GPD results • Threshold selection – e.g. TTCmin & rel. speed (4s and 15m/s) – e.g. T2min & rel. speed (2s and 18m/s) • Dependence – TTCmin & rel. speed or Delta-V0: 0.746 & 0.897 – T2min & rel. speed or Delta-V0: 0.999 both – Overall: there is weak or no dependence between temporal and speed related indicators 13 14 Bivariate GPD results Severity levels • Logistic distribution performs well • What is known • What is unknown • Probability based risk levels Severity levels Severity levels Relative speed or Delta- V0 (m/s) • Validation (?) R 1,1 R 0,1 R 0,1 R 1,1 u 2 R 1,0 R 1,0 R 0,0 R 0,0 0 u 1 TTC min or T 2min (s) 15 16 Severity combined with risk levels How about the other 3 regions? Severity levels Severity levels Relative speed or Delta- • Empirical copula (TTC-relative speed) V0 (m/s) R 1,1 R 0,1 R 1,1 R 0,1 u 2 R 1,0 R 1,0 R 0,0 R 0,0 0 u 1 TTC min or T 2min (s) 17 18
How about the other 3 regions? Conclusions • No or weak dependence – vehicles getting closer • Empirical copula (T2-relative speed) do not show high relative speed or Delta-V • Crash severity distribution can be constructed – validation even more problematic • Shape of empirical CDFs are different – steeper for crossing course T2 • No differences found between relative speed and Extended DeltaV • Resulting risk levels can be combined with severity levels 19 20 Further research • Validation – crash severity distribution Thank you! – Video based accident data for longer period – Speeds at collision • Bivariate models – Research on a dataset where Swedish TCT plane is available, or – Construct the severity lines first for other variable pairs • Other interactions • Threshold selection • … 21
Recommend
More recommend