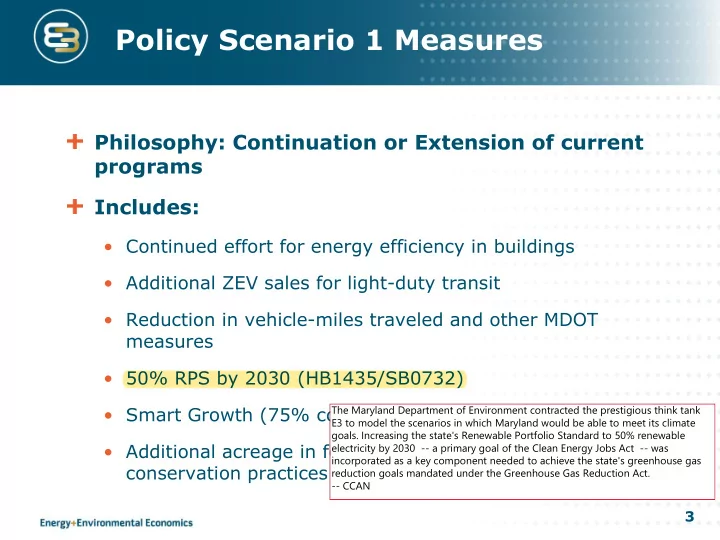

Policy Scenario 1 Measures Philosophy: Continuation or Extension of current programs Includes: • Continued effort for energy efficiency in buildings • Additional ZEV sales for light-duty transit • Reduction in vehicle-miles traveled and other MDOT measures • 50% RPS by 2030 (HB1435/SB0732) The Maryland Department of Environment contracted the prestigious think tank • Smart Growth (75% compact development goal) E3 to model the scenarios in which Maryland would be able to meet its climate goals. Increasing the state's Renewable Portfolio Standard to 50% renewable • Additional acreage in forest management and healthy soils electricity by 2030 -- a primary goal of the Clean Energy Jobs Act -- was incorporated as a key component needed to achieve the state's greenhouse gas conservation practices reduction goals mandated under the Greenhouse Gas Reduction Act. -- CCAN 3
Policy Scenario 1 Measures Increased Renewable Generation Electricity Generation by Resource 50% RPS by 2030 (HB1435/SB0732) Solar Imports Offshore Wind 25% RPS in 2020, 50% RPS in 2030, with solar Natural Gas (14.5%) and offshore Coal wind (10%) carveouts The graph at the top of this page titled "Electricity Generation Nuclear by Resource" shows imported renewable energy -- in red -- would continue but at a lower rate than the dramatically growing in-state solar and offshore wind. -- CCAN Achieves solar (14.5%) RPS Requirements and offshore wind (10%) carveouts, decreases proportion of RPS met by out-of- Tier 1 RECs state RECs relative to 25% RPS In-State Offshore Wind The graph at the bottom of this page titled "RPS Requirements" shows how renewable energy would grow In-State Solar to 50% of the Maryland grid by the year 2030. This would include a dramatic increase in in-state solar and in-state 5 offshore wind. -- CCAN
Policy Scenario 1 total GHG emissions This graph shows past, current, and projected greenhouse gas emissions in Maryland between 2006 and 2050. The dark blue line represents the effects of policies -- including the Clean Energy Jobs Act -- under Policy Scenario 1 as modeled by E3. As you can see, by 2030, the state hits its 40% reduction goal. -- CCAN Gap in 2020: 0.7 MMT (1% above goal) Gap in 2030: 2.4 MMT (5% above goal) Gap in 2050: 47.8 MMT 6
Recommend
More recommend