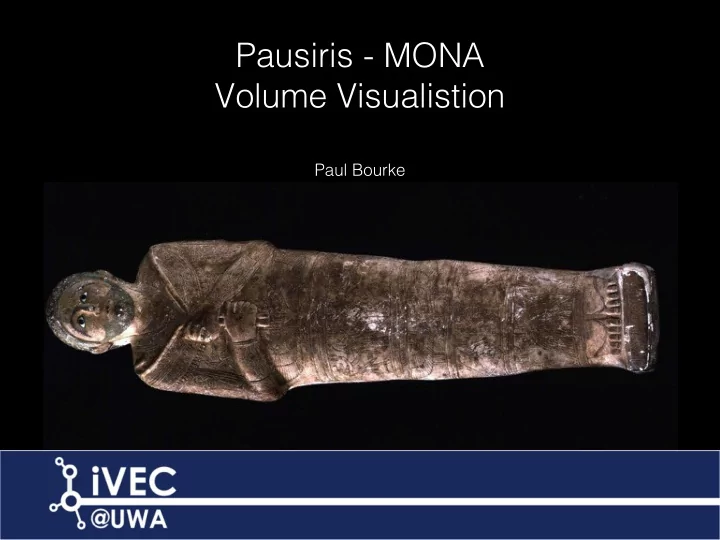

Pausiris - MONA Volume Visualistion Paul Bourke
Contents • iVEC • Visualisation @ iVEC • Some history • Ta-Sheret-Min • Volume visualisation • Cat • Pausiris • Live example • MONA exhibition
iVEC • Unincorporated joint venture between the 5 public research organisations in Western Australia UWA - Curtin - Murdoch - ECU - CSIRO • Main teams: supercomputing - data - visualisation • Managing the Pawsey facility, providing the compute for the Square Kilometer Array Pathfinder
Visualisation @ IVEC • Visualisation is around the use of advanced computer graphics and algorithms to provide researchers with insight into their datasets. • An interesting mixture between hard core computer science, engineering and technology but there is also a creative aspect. • Outcomes include - revealing something new in a dataset - providing understanding faster than by using lower order techniques - revealing errors, for example in simulation data • In addition to pure research, visualisation used - to convey research to colleagues - convey research to peers at conferences - visuals for papers - public outreach and education - outreach through museums, science centers - artistic expressions
History: Tasmania Museum and Art Gallery • TMAG - Islands to Ice exhibition. • Artist: Peter Morse. • Reasonable scale stereoscopic 3D theatre installed in 2006. • Cleaned up and presented a number of high resolution stereoscopic photographs by Frank Hurley.
Islands to Ice • Wonderful collection of stereoscopic pairs on glass plates. • Scanned and “cleaned up”.
Ta-Sheret-Min • Relatively low resolution 3D CT scan. • 2008-2009 • Egypt, Late Period, end 26th – 28th Dynasty, c. 664– 399 BCE; • Human remains, linen wrappings, wood, plaster, pigment.
Synthetic holograms
Crystal prints
Volume Visualisation • Volumetric data is now very common to a very wide range of disciplines. • 3D scanning of physical objects. For example MRI, CT, MicroCT. • Representations of simulations. For example fluid dynamics, cosmology, finite element techniques in engineering.
Voxels • A digital image contains some quantity sampled on a regular grid on a 2D plane. • In a volumetric dataset there is some quantity sampled on a regular 3D grid. In a volumetric dataset there is some quantity sampled on a regular 3D grid.
Examples of volume visualisation Cosmological simulations
Volume visualisation • The process of exploring and revealing the structure/interior of a volumetric dataset. • The general approach involves a mapping between voxel values and colour/ opacity.
Medical research
Raw data
Cat • Even lower resolution. • Remember CT only gives density so all colours are fake.
Pausiris • Egypt, Ptolemaic to Roman Period, 100 BCE – CE 100. • Human remains encased in stucco plaster with glass eyes, incised and painted decoration. • Provenance and identity had been confirmed. • Skeletal structure was intact, unopened. • Finally a high resolution CT (Computed Tomography) scan from the Hobart hospital newly acquired scanner. • Scanned in 3 parts, needed to be reassembled.
Whole mummy visualisation
Porosity • Volume rendering can also be applied to small samples for forensic or materials testing. • 1cm ^3 sample.
Animations
Live Example
MONA
Pausiris gallery Artists impression
Pausiris gallery, 24 hours to go
Pausiris gallery (final)
Cabinet
Cabinet
Cabinet
Cabinet
Pausiris gallery • Andres Serrano. • At what point does a dead person become an artefact rather than a person? A “he/she” vs an “it”? • The Morgue (Blood Transfusion Resulting In Aids), 1992.
Questions? After the break - 3D reconstruction from photographs
Recommend
More recommend