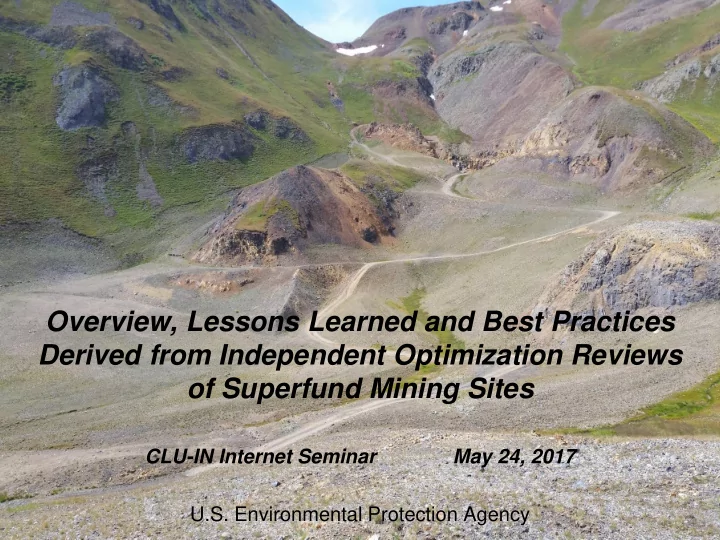
Overview, Lessons Learned and Best Practices Derived from Independent Optimization Reviews of Superfund Mining Sites CLU-IN Internet Seminar May 24, 2017 U.S. Environmental Protection Agency
Introduction • Welcome • Webinar Logistics • Presenters Kirby Biggs; EPA OSRTI TIFSD Jody Edwards, P.G.; Tetra Tech • >15 nations attending! 5/9/2017 U.S. Environmental Protection Agency 2
Webinar Outline • Status of Mine Sites in USA • What is Optimization? • EPA National Optimization Strategy Optimization Mine Sites Initiative Lessons Learned • Mine Site Characterization Best Practices • Optimization Review Case Studies • Summary • Questions Elizabeth Mine, VT 5/9/2017 U.S. Environmental Protection Agency 3
Mine Sites Status in USA
Abandoned Hardrock Mine Sites • Estimated 100,000 – 500,000 abandoned mine land (AML) sites Less than 500 AML sites documented 139 AMLs on NPL or being addressed by Superfund Alternative Approach • Internal and external collaboration to address sites efficiently and effectively EPA National Mining Team Federal Mining Dialogue Abandoned Uranium Mines Workgroup • Increasing collaboration with state, tribal and private partners • Specialty focus of EPA optimization review program 5/9/2017 U.S. Environmental Protection Agency 5
EPA National Mining Team Key Functions • Support mine related policy and regulatory issues • Provide technical information and site-specific assistance on Superfund sites • Improve EPA management of mining issues • Support Federal Mining Dialogue and other federal coordination activities • Support Optimization Studies at Mine sites 5/9/2017 6
Federal Mining Dialogue (FMD) • Principals Department of the Interior Department of Agriculture EPA • Additional Participants Department of Energy Department of Justice US Army Corps of Engineers Office of Management and Budget ASTSWMO • Open exchange of information on common challenges • Coordinating on development and publication of Best Practices 5/9/2017 U.S. Environmental Protection Agency 7
Abandoned Uranium Mine (AUM) Sites • 4,200 + sites identified, many more not inventoried • Many reside on tribal and federal lands • Mine site sizes vary but most are large, remote, and difficult to access • 37 large mines located in six states • Places to dispose waste is a challenge • Collaborative efforts to address sites 5/9/2017 U.S. Environmental Protection Agency 8
What is Optimization?
10 EPA’s Definition of Optimization Systematic site review by a team of independent technical experts, performed at any phase of a cleanup process, to identify opportunities to improve remedy protectiveness, effectiveness and cost efficiency, and to facilitate progress toward site completion. 5/9/2017 U.S. Environmental Protection Agency 10
Applies to Any Site, Program or Remedy Types of Sites / Programs Example Types of Remedies Evaluated DNAPL sites Groundwater extraction & treatment Dry cleaners Air sparging / Soil vapor extraction Gas stations Non-aqueous phase liquid recovery Industrial facilities Biosparging Landfills In situ thermal remediation MGP sites In situ chemical oxidation Mines / Mining districts In situ bioremediation Petroleum sites Sediment capping Sediment sites Permeable reactive barriers (PRB) Wood treating sites Constructed wetlands --------------------------- Landfill gas collection CERCLA/Superfund Surface water diversion/collection/treatment RCRA Monitored natural attenuation (MNA) State VCUP Brownfields Federal Facilities Tribal Investigation > Feasibility Study > Design > Remedial Action > LTMO > O&M
Examples of Technical Support • Programmatic support • Strategic planning support • Systematic project planning (SPP) facilitation • CSM development Project Life Cycle CSM https://clu-in.org/download/remed/csm-life-cycle-fact-sheet-final.pdf High-resolution site characterization (HRSC) 3-dimensional data visualization and analysis (3DVA) • Dynamic work strategy (DWS) development • Third-party technical review of site work plans and reports • Specialty characterization technology and sampling methods expertise 5/9/2017 U.S. Environmental Protection Agency 12
Typical Optimization Review Process Typical Site Visit Agenda • Engagement • Introductions • Scoping • CSM • • Project kick-off Remedy effectiveness/protectiveness • Extraction/injection systems • Document / data acquisition and • Treatment components review • Costs • Site visit and interviews • Environmental footprint reduction • • Site closure Data analysis • Debrief • Preliminary findings • Reporting • Requires expert level, Lessons learned compilation multidiscipline review team members 5/9/2017 U.S. Environmental Protection Agency 13
Sites That May Benefit From Optimization • Sites with: Protectiveness concerns Technological challenges CSM data gaps; high site uncertainties High costs for remedial activities Interim remedies • Sites not meeting Remedial Action Objectives (RAO) • Sites scheduled for five-year reviews (FYR) • Sites in long-term remedial action (LTRA) and/or nearing operations and maintenance (O&M) transfer to States 5/9/2017 U.S. Environmental Protection Agency 14
Focus of Optimization Reviews • Remedial goals • Maximize value of existing site documents and data • Conceptual site model (CSM) • Remedy performance • Protectiveness • Cost-effectiveness • Site completion / closure strategy • Environmental footprint 5/9/2017 U.S. Environmental Protection Agency 15
Other Benefits of Optimization • Site team and management provided with valuable 3rd-party perspective Provides path forward strategy Leverages adaptive management methods for flexibility Helps build consensus among site stakeholders Helps address community concerns Balances technical input from site contractors • Accelerates schedule for site closure • Facilitates transfer of LTRA sites to States • Cross-pollinates expertise among sites and site teams 5/9/2017 U.S. Environmental Protection Agency 16
EPA Optimization Resources • Two locations for online resources www.cluin.org/optimization www.epa.gov/superfund/cleanup-optimization-superfund-sites • Remediation Optimization: Definition, Scope and Approach www.cluin.org/optimization/pdfs/OptimizationPrimer_final_June2013.pdf • Site-specific optimization review reports www.clu-in.org/optimization/reports.cfm 5/9/2017 U.S. Environmental Protection Agency
EPA National Optimization Strategy
History of EPA Optimization Review Program Year Key Milestones 1997 Site optimization reviews initiated by EPA 1999 EPA-USACE-USAF collaboration on review practices Pilot project – applied USACE RSE optimization process at 4 P&T sites in LTRA phase 2000 Pilot project expansion – reviews at 16 additional P&T sites in LTRA phase 2001 2002 Development of guidance documents; internet seminars to address lessons learned 2003 Diversification of site type (other than P&T); reviews performed earlier project phases ‘ Optimization Action Plan ’ formalized optimization for Superfund Fund -lead LTRA sites 2004 2004 – 2005 Pilot project in Region 3 for streamlined approach to optimization reviews 2010 After 150 sites reviewed, EPA directs development of National Optimization Strategy 2010 – 2012 Strategy developed by national EPA workgroup (HQ / Regions / Office of R&D) Formal release of “National Strategy to Expand Superfund Optimization Practices from Site 2012 Assessment to Site Completion” ; Sept 12, 2012 2012 – 2013 Development of standard operating procedures (SOP) and other technical resources 2017 224 optimization reviews performed to date USA-wide 2017+ Expansion and training of optimization review resources; inclusion in new EPA contracts
EPA National Optimization Strategy Issued September 28, 2012 EPA’s National Strategy to Expand Superfund Optimization ■ Practices from Site Assessment to Site Completion (2012) Systematic site review by a team of independent technical experts… ■ Performed at any phase of a cleanup process… ■ Identify opportunities to improve remedy protectiveness, effectiveness and cost efficiency… ■ Facilitate progress toward site completion. 5/9/2017 U.S. Environmental Protection Agency 20
Completed Optimization and Technical Support Events Number of Number of EPA Total Events % per Region Events Events Region 1997 to Date 1997-2010 2011-2016 1 10 13 23 10 % 2 12 14 26 12 % 3 18 8 26 12 % 4 11 4 15 7 % 5 12 4 16 7 % 6 5 16 21 9 % 7 15 21 9 % 7 8 4 19 23 10 % 9 6 21 27 12 % 10 10 16 26 12 % TOTAL 95 130 224 100 % 5/9/2017 U.S. Environmental Protection Agency 21
Recommend
More recommend
Unleash a World of Digital Possibilities—Browse, Share, and Explore Content Without Boundaries