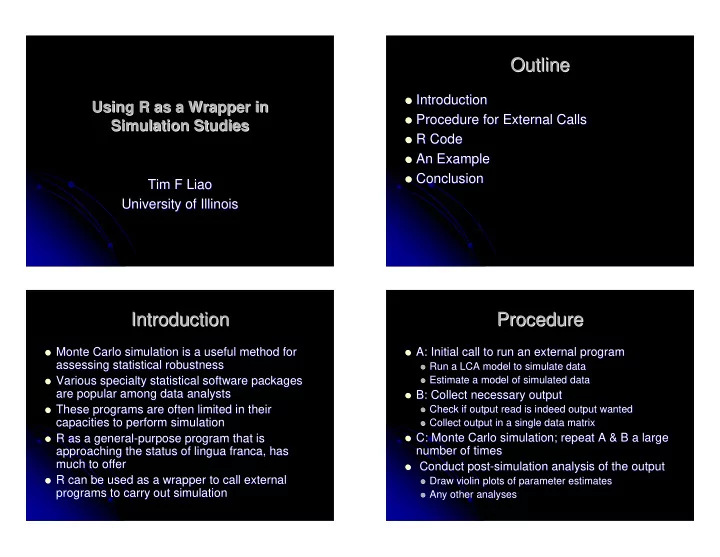

Outline Outline � Introduction Introduction � Using R as a Wrapper in Using R as a Wrapper in Simulation Studies � Procedure for External Calls Procedure for External Calls Simulation Studies � � R Code R Code � � An Example An Example � � Conclusion Conclusion � Tim F Liao Tim F Liao University of Illinois University of Illinois Introduction Procedure Introduction Procedure � Monte Carlo simulation is a useful method for Monte Carlo simulation is a useful method for � A: Initial call to run an external program A: Initial call to run an external program � � assessing statistical robustness assessing statistical robustness � Run a LCA model to simulate data Run a LCA model to simulate data � � Various specialty statistical software packages Various specialty statistical software packages � Estimate a model of simulated data Estimate a model of simulated data � � are popular among data analysts are popular among data analysts � B: Collect necessary output B: Collect necessary output � � These programs are often limited in their These programs are often limited in their � Check if output read is indeed output wanted Check if output read is indeed output wanted � � capacities to perform simulation capacities to perform simulation � Collect output in a single data matrix Collect output in a single data matrix � � C: Monte Carlo simulation; repeat A & B a large C: Monte Carlo simulation; repeat A & B a large � R as a general R as a general- -purpose program that is purpose program that is � � approaching the status of lingua franca, has number of times number of times approaching the status of lingua franca, has much to offer much to offer � Conduct post Conduct post- -simulation analysis of the output simulation analysis of the output � � R can be used as a wrapper to call external R can be used as a wrapper to call external � � Draw violin plots of parameter estimates Draw violin plots of parameter estimates � programs to carry out simulation programs to carry out simulation � Any other analyses Any other analyses �
R Code R Code Example: Latent Class Analysis Example: Latent Class Analysis #test run of 1000 simulations #test run of 1000 simulations T <- T < - 1000 1000 C <- - 30 30 C < � Assuming for the data the model structure: Assuming for the data the model structure: � zM< <- -matrix(rep(0,C* matrix(rep(0,C*T),nrow T),nrow=T) =T) zM for(i in (1:T)) { in (1:T)) { for(i #the zM zM simulations simulations #the ( ) ∑ log = + X + A + B + C + D + E + R * + XA + XB + XC + XD + XE + β − system("c:/temp/simlem/lem c:/temp/simlem/SimM1a.inp c:/temp/simlem/SimM1a.inp m u u u u u u u u u u u u u V V system("c:/temp/simlem/lem xabcder * x a b c d e j xa xb xc xd xe x r * c:/temp/simlem/SimM.out c:/temp/simlem/SimM.out") ") j system("c:/temp/simlem/lem c:/temp/simlem/Sim5E1.inp system("c:/temp/simlem/lem c:/temp/simlem/Sim5E1.inp c:/temp/simlem/Sim5E.out") c:/temp/simlem/Sim5E.out") a1<- a1< -read.table("c:/temp/simlem/simla.out")[4,] read.table("c:/temp/simlem/simla.out")[4,] � Varying Varying � … … … … b4<- -read.table("c:/temp/simlem/simla.out")[17,] read.table("c:/temp/simlem/simla.out")[17,] b4< � presence of non presence of non- -na naï ïve MNAR association ve MNAR association � b5<- b5< -read.table("c:/temp/simlem/simla.out")[21,] read.table("c:/temp/simlem/simla.out")[21,] a <- - a1+a2+a3+a4+a5 a1+a2+a3+a4+a5 a < � true latent class proportions true latent class proportions � b <- - b1+b2+b3+b4+b5 b1+b2+b3+b4+b5 b < if (a<b) { if (a<b) { � sample size sample size � zM[i,1]<- -read.table("c:/temp/simlem/simla.out")[2,] read.table("c:/temp/simlem/simla.out")[2,] zM[i,1]< } } � Using the model to estimate Using the model to estimate � else { else { zM[i,1]<- zM[i,1]< -read.table("c:/temp/simlem/simla.out")[3,] read.table("c:/temp/simlem/simla.out")[3,] } } … … … … } } Violin Plots of Likelihood Ratio of 1,000 Simulations (N=200) by True Latent Class Proportion and Association Parameter Violin Plots of BIC of 1,000 Simulations (N=200) by True Latent Class Proportion and Association Parameter 140 −480 120 −500 Likelihood Ratio Statistic 100 −520 BIC 80 −540 60 −560 40 π=0.1,β=0 π=0.1,β=1 π=0.2,β=0 π=0.2,β=1 π=0.3,β=0 π=0.3,β=1 π=0.4,β=0 π=0.4,β=1 π=0.5,β=0 π=0.5,β=1 π=0.1,β=0 π=0.1,β=1 π=0.2,β=0 π=0.2,β=1 π=0.3,β=0 π=0.3,β=1 π=0.4,β=0 π=0.4,β=1 π=0.5,β=0 π=0.5,β=1
Violin Plots of Latent Probability of 1,000 Simulations (N=200) by True Latent Class Proportion and Association Parameter Conclusion Conclusion 0.7 0.6 � R is the most flexible in facilitating R is the most flexible in facilitating � simulation using existing specialty simulation using existing specialty 0.5 Latent Class Probability software software 0.4 � The collection of necessary output can The collection of necessary output can � 0.3 only be ad hoc only be ad hoc 0.2 � The procedure can apply to other popular The procedure can apply to other popular � statistical software packages such as statistical software packages such as 0.1 MPlus, which can also run in dos mode MPlus , which can also run in dos mode 0.0 π=0.1,β=0 π=0.1,β=1 π=0.2,β=0 π=0.2,β=1 π=0.3,β=0 π=0.3,β=1 π=0.4,β=0 π=0.4,β=1 π=0.5,β=0 π=0.5,β=1
Recommend
More recommend