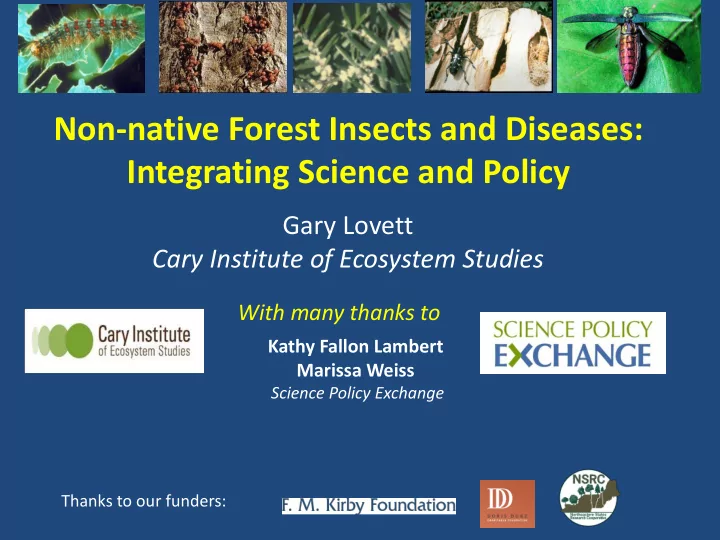

Non-native Forest Insects and Diseases: Integrating Science and Policy Gary Lovett Cary Institute of Ecosystem Studies With many thanks to Kathy Fallon Lambert Marissa Weiss Science Policy Exchange Thanks to our funders:
A Forest Pest and Pathogen Initiative Goal: To provide a scientific synthesis of ecological and economic impacts and to motivate policy action Approach and Activities • Assembled team of ecologists, economists, and policy experts • Synthesis paper: in revision for the journal Ecological Applications • Communication and outreach – Translation piece – Press kit and media roll- out – Briefings with influence leaders – Ongoing communication and outreach
The Problem: Continued invasion by forest pests 500 450 All insects: 2.6 per year Cumulative Number of Pests 400 since 1850 350 Wood borers: 1.2 per year 300 since 1985 250 All Insect Pests 200 150 Wood Borers 100 50 0 1750 1800 1850 1900 1950 2000 2050 From Lovett et al. in revision; data from Aukema et al . Bioscience 2010
The Problem: Continued invasion by forest pests 700 40 All insects: 2.6 per year 35 600 since 1850 Cumulative value of imports (Trillions of 2010 $) Value of Cumulative Number of Pests Imports 30 Wood borers: 1.2 per year 500 since 1985 25 400 20 300 15 All Insect 200 Pests 10 100 5 Wood Borers 0 0 1750 1800 1850 1900 1950 2000 2050 From Lovett et al. in revision
Biological Pollution From Liebhold et al. Diversity and Distributions (2013)
Ecosystem Disturbance Wildlife Habitat Productivity & Nutrient Communities Canopy Species Compromised Cycles Altered Transformed Eliminated > 100 million trees killed in US >30,000 trees killed in Worcester, MA
Economic Impacts • Impacts of insects alone estimated in the billions of dollars per year ( Aukema et al. 2011 ) – Forestry impacts small compared to urban and suburban impacts – Largest costs borne by homeowners and municipal governments – Costs include takedown and replacement of street trees and yard trees, lost property value – These estimates do not include introduced diseases
Policy Options Focus on Prevention of Establishment CLEAN PATHWAYS * Wood packing material * Live plants PREVENT ESTABLISHMENT * Post-entry quarantine POINT OF ORIGIN * Integrated surveillance system * Funding for rapid eradication * Monitor “sentinel trees” abroad * Pre-clearance partnerships WOOD PACKING MATERIAL LIVE PLANTS • • Phase out use of WPM Phase out import of live woody plants • • Promote voluntary substitution of Switch to a “white - list” screening WPM by retailers system or add all N. American woody • Improve existing WPM treatment genera to NAPPRA list • regulations Certify “pest - free” retailers • • Strengthen enforcement and penalties Strengthen enforcement and penalties
Science-Policy Linkage • Improve quality of inspection data • Enhance access to APHIS and CBP data by other government agencies and academic researchers • Provide regular data analysis and reporting on effectiveness of policies • Develop accessible global databases and information systems
Focus on Urban Forests Photo: Portland Oregonian • Urban forests are both sentinels • Ecosystem services provided and beachheads for invasion per tree are greater in urban and suburban ecosystems • Economic value of damage is • greatest for urban and suburban High potential for public forests engagement
Strategy for Impact • Use science to build constituency and a coalition of engaged foundations, NGOs, municipal and state governments • Use science to focus attention on strengthening existing US policies and programs • Use media attention to prompt corporate conversations around clean packaging and clean plants 500 450 All insects: 2.6 per year • Goal: To bend the invasion curve Cumulative Number of Pests 400 since 1850 350 Wood borers: 1.2 per year 300 since 1985 250 All Insect 200 Pests 150 Wood Borers 100 50 0 1750 1800 1850 1900 1950 2000 2050
Recommend
More recommend