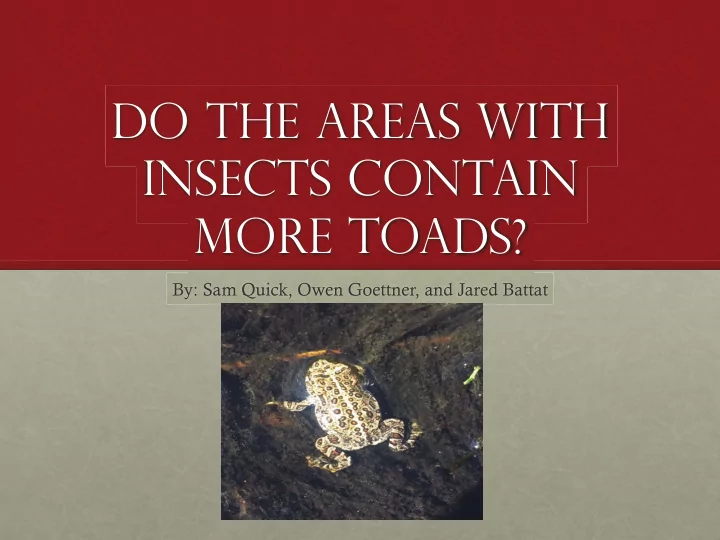

Do the areas with insects contain more toads? By: Sam Quick, Owen Goettner, and Jared Battat
Purpose • Goal: to find correlations between population of toads and population of insects • Since toads feed on aerial insects, do toads gravitate towards areas with more of these insects?
Hypothesis The areas that contain more aerial insects will contain more toads. There will be more insects and toads near water, as opposed to the dry areas with little vegetation.
Null hypothesis There is no correlation between the population of aerial insects and toads. Dry versus wet areas will not have an effect on toad and insect populations.
Materials • Sticky Insect Traps • Metal Stakes • Bucket • Observation Tray • Pencil • Notebook
Methods 1. Collect materials. 2. Go to Van Norden Meadow. 3. Connect the sticky insect traps with the metal stakes. 4. Chose sticky insect trap locations based on areas with toads and water, areas with water and no toads, and areas with no toads and no water. 5. Place the sticky insect traps in the locations previously determined. 6. Note the time that the traps are put out. 7. Attempt to catch toads at each location for twenty minutes. 8. Record the data of the amount of toads collected. 9. After 1 hour of the sticky insect traps being out, count the number of insects. 10. Record this data. 11. Repeat steps 3-10 at every location two more times for sufficient data.
Area Description Area 1 •Shallow pond, rocky bank, surrounded with high grasses •Shallow pond, rocky bank, surrounded with vegetation on one side Area 7 Area 2 •Away from stream, dry land, some vegetation •Deep stream, high vertical bank surrounded with high vegetation (grasses) Area 8 Area 3 •Away from stream, dry land, some vegetation •Shallow stream, rocky bank, surrounded with vegetation Area 9 Area 4 •Away from stream, dry land, some vegetation •Pond surrounded with rocks and vegetation, by a drainage pipe Area 10 Area 5 • Shallow pond, rocky bank, some vegetation, under bridge • Deep stream, high bank with vegetation
Pictures of areas Water with Toads Water without Toads No Water No Toads
Round 1 Data R ² = 0.26862 Round 1 Data 3.5 • Graph shows an upward 3 slope 2.5 2 • Outlier 2 Explained Frogs 1.5 1 • Fairly low R 2 0.5 0 0 2 4 6 8 10 12 14 16 18 • Measurements taken all -0.5 Insects before noon • Insects are cold blooded � not out this early
Round 2 Data R ² = 0.61863 Round 2 Data 3.5 • High upward slope 3 2.5 2 • Better R 2 number Frogs 1.5 1 • Measurements taken 0.5 0 around early afternoon 0 2 4 6 8 10 12 14 -0.5 -1 Insects • Temperature at its highest • Frogs/Insects more active • Outliers 2 explained
Round 3 Data Round 3 Data R ² = 0.10597 • Gradual upward slope 3.5 3 2.5 • Very low R 2 number Frogs 2 1.5 • Earliest measurements of all 1 rounds 0.5 0 0 2 4 6 8 10 • Coldest temperature of all Insects rounds • Frogs/Insects less active • Outliers 6 and 7 explained
Discussion/ Conclusion • Conclusion 1: Round 2 affirms hypothesis • More accurate correlation between toads and insects and high R 2 number But… • Warmer temperatures • Later in the day • Conclusion 2: Rounds 1 and 3 show that the null hypothesis is partially correct • Little correlation between toads and insects and low R 2 number But… • Colder Temperatures • Earlier in the day
Conclusions • Warm temps � more toads present in areas with more aerial insects • This trend supports the hypothesis • However, with cold temps � no clear relationship between toads and insect • This trend does not support the hypothesis
Improvements/ Next Step • Possible improvements: • More Data • Consistent air temperatures • Better knowledge of toad ecosystems • Recording the air temperature • What’s Next? • Other factors influencing toad and insect population? • How do turbidity, nutrient levels, outside temperature, and water temperature play in? • What factors influence where insects live? • Could Chytrid fungus affect the toads living in this area?
Thanks for Listening! Questions?
Recommend
More recommend