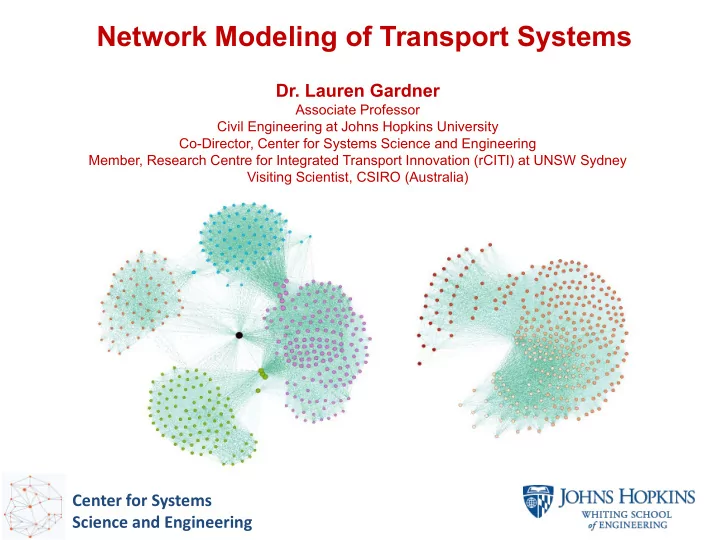

Network Modeling of Transport Systems Dr. Lauren Gardner Associate Professor Civil Engineering at Johns Hopkins University Co-Director, Center for Systems Science and Engineering Member, Research Centre for Integrated Transport Innovation (rCITI) at UNSW Sydney Visiting Scientist, CSIRO (Australia) Center for Systems Science and Engineering
Research Areas of Focus Mobility and Epidemiology • Role of Transportation in Disease Spread • Quantification of Disease Spreading Risk • Predicting Outbreak Behaviour Patterns • Optimizing Intervention Strategies Pricing for Transport Networks • Model Road Pricing Schemes • Consider Uncertainty/Information • Compare Policy Options • Quantify System Performance Planning for Alternative Vehicle Technologies • Integration of Power and Transport Systems • User Behaviour • Sustainability Metrics • Policy Development • Multi-Objective Network Design
Overview of Research Methods Hypothesis : The movement of people, pathogens and vectors ( e.g., mosquitos) plays an integral role in the risk of disease. Objective: Exploit available information to infer and predict local and global patterns of contagion , quantify the risk posed ( e.g., by components of transport systems) in the spread of disease, and design optimal mitigation strategies Methods: i. Mathematical modeling ii. Network theory iii. Optimization iv. Simulation v. Statistics Contributions: i. Policy evaluation and decision support ii. Optimize resource allocation
Large-scale Data Requirements Case Geo-location Data Environmental, Land-use and Climate Local Mobility Global Transport Networks Social Media, Cell phone, Credit Card, Google, etc
Social-Contact Network Models Can we use available spatiotemporal infection data (and other information) to better understand the risk posed by an outbreak?
Modeling Public Transit Contact Patterns Local Mobility Patterns “Flu on the Bus” Problem Define Contact Networks High Risk Transit Trips Extract ridership data Apply network- based statistics, algorithms and simulation Bota, et al. (2017), Netw Spat Econ .
Public Transit Network Analysis Contact network. Large circles represent vehicle-trips Vehicle trip network • Nodes ← vehicle trips loads • Links ← transfer passenger volumes Vehicle Trip Network: • 8002 nodes (vs 94,475) • 263,792 links (vs 6,287,847) Fig. Vehicle-trip network
Planning for New Vehicles Technologies Research Questions: 1. How will infrastructure and planning decisions change due to the presence of new vehicle technologies? e.g., Electricity Pricing, EV charging Station location, Transport System Design Objectives (safety, emissions, etc) 2. How does the behaviour of drivers change in the presence of these new technologies? Research Applications : Integration - Convergence of transport/power systems Planning - Demand-Supply for electric power grid User Behaviour – Range Anxiety, Routing Sustainability - Upstream emissions Policy Decisions - Charging Infrastructure Location Network Design Problem – Multiple objectives
Modeling Sustainable Transport Systems: Policy: Behavioural: • standards Economic: • incentives • consumers • affordability • travellers • business models • range anxiety • financing • education Transportation: ELECTRIC VEHICLES Technology: • improve battery storage • network modelling • power train configuration • distance limitations • destination choices, route choice • infrastructure improvement Electric Power Systems: Energy: • encourage clean sources • Smart Grid • reduce fossil fuel dependence • effective management • charging infrastructure • mobile storage devices
Modeling the System Impact of Travel Demand Variability on Emissions and Congestion ★ The expected performance of a system may not be correlated to the variability of the system These are the the same design scenario and so on 10% 5% Change in network performance Δ TSTT STD Change in network performance 8% 4% Δ TSEC_PEV STD Expected Δ TSTT 6% Expected Δ TSEC_PEV due to project 3% due to project 2% 4% 1% 2% 0% 0% -1% Design Scenarios -2% Design Scenarios -2%
Modelling Spatiotemporal EV Uptake and Energy Consumption Rates Relative likelihoods that AECOM Vehicle Average daily distance households in each CCD + Sales Forecast for + driven by a vehicle owner would purchase an electric Sydney GMA residing in each CCD. vehicle.
Thank You Email: l.gardner@jhu.edu Office: Latrobe 104 Center for Systems Science and Engineering
Recommend
More recommend