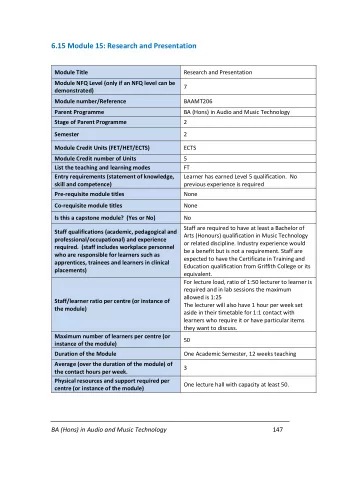
Module 8: Evaluating Vaccine Efficacy Instructors: Dean Follmann, Peter Gilbert, Betz Halloran, Erin Gabriel, Michael Sachs Session 9: Introduction to Sieve Analysis of Pathogen Sequences, for Assessing How VE Depends on Pathogen Genomics − Part 2 Summer Institute in Statistics and Modeling in Infectious Diseases University of Washington, Department of Biostatistics Course materials at: July 18 − 20, 2016 http://faculty.washington.edu/peterg/SISMID2016.html 07/14 ‐ 16/2014 • 0
Outline of Session 9 1. Sieve Analysis Via Cumulative and Instantaneous VE Parameters 2. Cumulative VE Approach: NPMLE and TMLE 3. Mark-Specific Proportional Hazards Model 4. Example 1: RV144 HIV-1 Vaccine Efficacy Trial 5. Example 2: RTS,S Malaria Vaccine Efficacy Trial 5.2.2016 • 1
Sieve Analysis of HIV-1 Sequences Infecting Participants in an HIV-1 Vaccine Efficacy Trial Circulating HIV Strains In the setting of the vaccine trial 0, 1, 2, 3, 4 … Placebo Group Vaccine Group Natural Barrier to HIV Infection Vaccine Barrier To HIV Infection 5 5 4 # Isolates 4 # Isolates 3 3 2 2 1 1 0 1 2 3 … 0 1 2 3 … Distribution of Distribution of Infecting Strain Infecting Strain RV144 n=74 infections n=51 infections trial VE = 31% 95% CI 1% to 51%, p=0.04 Rerks-Ngarm et al. (2009, NEJM ) 5.2.2016 • 2
Focus the RV144 Sieve Analysis on Statistically x Biologically Relevant HIV-1 AA Sites To maximize power, pre ‐ filter AA sites based on treatment ‐ blinded data Exclude difficult ‐ to ‐ align sites and too ‐ conserved sites 1. Restrict to the 85 Env V1V2 AAs constituting the gp70 ‐ V1V2 reagent 2. Restrict to sites potentially part of reactive antibody epitopes 3. Sites potentially part of reactive antibody epitopes: Require all 3 • Env reactivity hotspots of vaccine ‐ induced binding antibodies (David Montefiori et al. ) • Published monoclonal antibody ‐ gp120 contact sites (Peter Kwong et al. ) • Potential antibody epitopes based on structural biology (Bill Schief et al. ) Rolland, Edlefsen et al. (2012, Nature) focused on the AA sites meeting all of the above criteria n=9 Env V2 AA sites 5.2.2016 • 3
Results of Focused RV144 Sieve Analysis 2 AA sites with evidence (q-value < 0.20) of a different frequency of AA mismatch to the vaccine insert residue HIV-1 Genotype Estimated VE* 95% CI P-value 169 match 48% 18% to 66% 0.0036 169 mismatch -55% -258% to 33% 0.30 181 match 17% -26% to 45% 0.38 V2 Loop Crown 181 mismatch 78% 35% to 93% 0.0028 *Differential VE by genotype: 181 169: p = 0.034 181: p = 0.024 169 α 4 β 7 binding motif Statistical tests: • Cox model (Lunn and McNeil, 1995, Biometrics ) • Targeted MLE (Benkeser, Carone, Gilbert, submitted ) 5.2.2016 • 4
Frequencies of Infection with HIV-1 Genotypes Defined by V2 Sites 169 & 181* *Figure 2 from Rolland, Edlefsen et al. (2012, Nature ) 5.2.2016 • 5
Cumulative Incidences of Infection with HIV-1 Genotypes Defined by V2 Sites 169 & 181* *Supplementary Figure 3 from Rolland, Edlefsen et al. (2012, Nature ) Aalen-Johansen nonparametric MLEs 5.2.2016 • 6
http://dx.doi.org/10.1016/j.immuni.2012.11.011 Functional Mechanism Follow-Up Alanine scanning showed that V2 binding of RV144 vaccine ‐ induced V2 Abs • CH58 and CH59 = mAbs from is abrogated by RV144 infected ppts that recognize K169A mutation a V2 epitope containing site 169 • mAbs mediated the effector function ADCC against RV144 trial breakthrough Env ‐ target cells, and but not by this ADCC activity was dependent I181A on site 169 Figure 1 Binding of RV44 mAbs CH58 and CH59 to 5.2.2016 • 7 HIV-1-Infected Cells and to HIV-1 V2 Peptides
Outline of Session 9 1. Sieve Analysis Via Cumulative and Instantaneous VE Parameters 2. Cumulative VE Approach: NPMLE and TMLE 3. Mark-Specific Proportional Hazards Model 4. Example 1: RV144 HIV-1 Vaccine Efficacy Trial 5. Example 2: RTS,S Malaria Vaccine Efficacy Trial 5.2.2016 • 8
RTS,S Malaria Sieve Analysis Core Team Fred Hutchinson Cancer Broad Institute of MIT and Harvard Research Center • Dan Neafsey • Trevor Bedford • Dyann Wirth • David Benkeser • Karell Pellé, Clarissa Valim • Peter Gilbert • Allison Griggs, Bronwyn MacInnis GlaxoSmithKline Vaccines • Michal Juraska • Marc Lievens • Ted Holzman Path Malaria Vaccine Initiative • Chris Ockenhouse 5.2.2016 • 9
RTS,S/AS01 Malaria Vaccine (3D7 reference strain) Plasmodium falciparum life cycle RTS,S 5.2.2016 • 10
RTS,S/AS01 Phase 3 Vaccine Efficacy Trial • Conducted by GSK and the PATH Malaria Vaccine Initiative at 11 sub ‐ Saharan African sites between 2009 ‐ 2014 • Two age cohorts: • 6,537 infants 6 ‐ 12 weeks • 8,923 children 5 ‐ 17 months Endpoint Follow ‐ Up 2:1 M14 M20 5.2.2016 • 11
RTS,S/AS01 Vaccine Efficacy Trial Results Infants aged 6 ‐ 12 weeks • N = 4358:2179 randomized to RTS,S: Control • n = 1161:714 clinical malaria events • Est. VE * = 31% (97.5% CI, 24% to 38%) *Hazard-ratio based VE against clinical malaria during 12 months after vaccination in infants who received all 3 doses of vaccine according to protocol 5.2.2016 • 12
RTS,S/AS01 Vaccine Efficacy Trial Results Children aged 5 ‐ 17 months • N = 3997:2003 randomized to RTS,S: Control • n = 932:752 clinical malaria events • Est. VE * = 56% (97.5% CI, 51% to 60%) *Hazard-ratio based VE against clinical malaria during 12 months after vaccination in children who received all 3 doses of vaccine according to protocol 5.2.2016 • 13
Instantaneous Vaccine Efficacy Wanes Over Time Infants aged 6 ‐ 12 weeks Children aged 5 ‐ 17 months 5.2.2016 • 14
Sieve Analysis for Malaria 5.2.2016 • 15
First RTS,S Sieve Analysis Results (Published October 21, 2015) 5.2.2016 • 16
Analysis Cohort and Malaria Endpoint • Per ‐ protocol cohort • Received the Month 0, 1, 2 immunizations according to protocol • Endpoint: Primary case definition of clinical malaria • First or only illness episode with a temperature of ≥ 37.5 ° C and >5000 P. falciparum parasites per mm 3 or a severe malaria case • Count endpoints 14 − 385 days post immunizations 5.2.2016 • 17
Sequencing of Malaria Endpoints [Broad Institute] • CS C ‐ terminus and SERA2 control amplicons sequenced with Illumina MiSeq • All sequence data screened for random and systematic errors using validated pipelines • After error filtration: • 4,421 samples for the CS C ‐ terminus amplicon • 4,499 samples for the SERA2 amplicon 5.2.2016 • 18
Structuring Parasite Genomic Variation • Summarize genomic features of a given founder malaria parasite by: • Perfect vaccine haplotype (3D7) match or mismatch (binary feature) • Applied for 6 regions and 42 individual AA positions • Full SERA2 amplicon, full CS C ‐ terminus amplicon Circumsporozoite protein • 4 haplotype regions in CS C ‐ terminus: Th2R, Th3R, DV10, LD* • Polymorphic AA positions in the CS C ‐ terminus (25 AA positions) and in SERA2 (17 AA positions) * AA positions 314, 317, 352, 354, 356, 357 • Genomic feature definitions finalized prior to sieve analysis based on treatment ‐ blinded descriptive analysis of the malaria genomic data 5.2.2016 • 19
Statistical Assessment of 3D7 Match vs. Mismatch Sieve Effects Applied cumulative and prop. hazards VE methods • Estimate VE cum/disc (t, j) for j=(match, mismatch) t through Month 14 • Test H0: VE cum/disc (t=14 mo, j=match) = VE cum/disc (t=14 mo, j=mismatch) Aalen ‐ Johansen NPMLE and TMLE (Benkeser, Carone, Gilbert, 2016) • Estimate VE haz/disc (j) for j=(match, mismatch) t through Month 14 • Test H0: VE haz/disc (j=match) = VE cum/disc (j=mismatch) Cox model and Lunn and McNeil (1995, Biometrics ) test 5.2.2016 • 20
Complexity of Infection (COI) • Approximately 70% of cases are complex, with multiple founder haplotypes • Sieve analyses are done on datasets with one founder haplotype randomly sampled from each case with COI ≥ 2 • The VE parameters are interpretable under the assumption that each founder is an independent mosquito transmission event • Multiple outputation (Follmann, 2003, Biometrics ) is used to obtain a valid/unbiased analysis • Repeat the sieve analysis for a large number of sampled datasets with one founder per case, average results to obtain overall results • For each analysis, the number of multiple outputations is selected to make the results very similar to what would be obtained with exhaustive multiple outputation 5.2.2016 • 21
Approach to Multiplicity of Sieve Effect Tests • Multiplicity adjustment for the sieve effect p ‐ values separately for the 2 age categories, the 2 proteins (CS, SERA2), the 2 endpoints, and the 2 VE parameters • Holm ‐ Bonferroni adjusted p ‐ values and q ‐ values • Statistically significant sieve effect defined as q ≤ 0.20 for multiply compared loci and as unadjusted p ≤ 0.05 for the full amplicon analysis 5.2.2016 • 22
Per-Protocol Category of 6-12 Week Olds: Clinical Malaria Endpoint Sequence data from 80% of cases 5.2.2016 • 23
Recommend
More recommend
Unleash a World of Digital Possibilities—Browse, Share, and Explore Content Without Boundaries