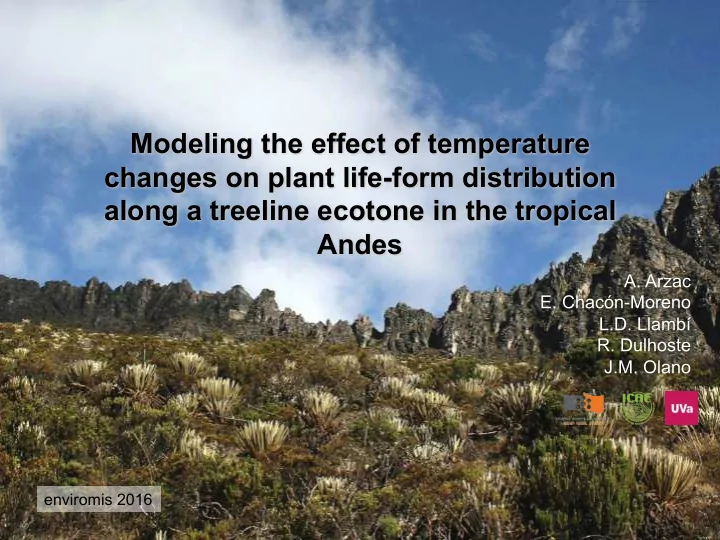

Modeling the effect of temperature changes on plant life-form distribution along a treeline ecotone in the tropical Andes A. Arzac E. Chacón-Moreno L.D. Llambí R. Dulhoste J.M. Olano enviromis 2016
Introduction enviromis 2016 Biodiversity hotspot Tropical Andes Ecosystem services Impacts & Water Dynamic Species Human activities vulnerability resources richness Livestok Andean Treelines Climate Agriculture Climate-vegetation link Adaptative mechanisms Previous works have shown that temperature and incident radiation, determined by elevation and slope orientation gradients, can modulate the tropical treeline position.
Introduction enviromis 2016 In the northern Andes, the treeline ecotone corresponds to a complex and species rich transition boundary between continuous high mountain forests and grasslands “páramos” Trees and tall shrubs are replaced by tussock grasses, small sclerophyllous shrubs and caulescent rosettes with altitude Richness peaks
Introduction Life-form classification system Hedberg (1964): Arzac et al . (2011): • Classification of Afroalpine • Adaptation of Hedberg vegetation into 5 categories system including: trees, according to morphological bamboos and non-grass features: Caulescent Acaulescent Tussock herbs. rosettes rosettes grasses • Leaf morphological characteristics: pubescense in rosettes and size leaf in shrubs Sclerophyllous Cushion plants shrubs
Study questions enviromis 2016 Two main questions: Ø Dominant plant life-forms will respond differently to altitude and slope orientation, influencing treeline vegetation structure and the spatial distribution of vegetation belts Ø Plant life-forms will respond differently under temperature increase scenarios, modifying vegetation physiognomy across the treeline ecotone.
Study area enviromis 2016 Tomsk Venezuela
Study area enviromis 2016 Study area: • Altitudinal gradient (3300-3550 masl) • Forest-páramo ecotone • Mérida cable car system (Venezuela) Climate: • Mean Temperature: 7.1 ºC • Annual precipitation: 1811 mm • Bimodal precipitation pattern Altitude (m) 3600 Morphology: 3520 3400 • Slope between 15 – 40º 3360 • Slope orientation varied between 3280 North, North-West and West 3200
Study area: Vegetation enviromis 2016 Grassland-páramo at the top of gradient Mountain forest at the bottom of gradietn
Sampling design enviromis 2016 Transects 3.550 m Elevational gradient 25 m 3.300 m ST3 ST4 ST1 ST2 ST5 ST6 20 cm 2 m Transects: 6 Point quadrat method Sampling units: 48 Sampling points: 4800 10 m Sampling unit
Data analysis enviromis 2016 Five plant life-forms were chosen for further analysis based on their relative abundance and structural importance (defining the major vegetation physiognomic types across the treeline ecotone). Plant life-form Distribution Temperature along the gradient change scenarios models Multiple regression Regression models Projections based on models were climate change were carried out to performed to analyze obtain the predictive models used in the the response of cover Fifth Assessment models to be for each plant life- Report of the integrated into the form as a function of geographical Intergovernmental altitude and slope Panel of Climate information system. orientationndepende Change (AR5) nt variables)
Results: Plant life-form distribution along the gradient enviromis 2016 Distribution CPR and SS at the top (3489 & 3476 masl). TG and CNR in the middle (3455 & 3425 masl) Trees at the bottom (3390 masl)
Results: Distribution models (current climate conditions) 12 16 20 40 100 0 20 60 80 0 4 8 12 16 20 20 40 60 80 10 0 4 8 0 Caulescent Caulescent Tussock grasses Tress pubescent non-pubescent rosettes rosettes
Study species • Hierarchy of climate models: Coupled Model Intercomparison Project Phase 5 (CMIP5) of the World Climate Research Program • Four Representative Concentration Pathways (RCPs) scenarios were used: RCP2.6, RCP4.5, RCP6.0 and RCP8.5. • Predictions focused for years 2040 & 2060 Temperature difference inrelation with period 1986-2005 (ºC) 2025-2055 (2040) 2045-2075 (2060) RCP 4.5 0.7 0.9 RCP 6.0 1.3 1.9 RCP 8.5 1.8 2.6
Results: Distribution under climate change scenarios enviromis 2016 Caulescent Caulescent non- pubescent rosettes pubescent rosettes RCP4.5 RCP6.0 RCP8.5 RCP4.5 RCP6.0 RCP8.5 (A) (C) (E) (G) (K) (I) 2040 (H) (B) (F) (J) (L) (D) 2060
Results: Climate response and SPEI enviromis 2016 Tussock grasses Trees RCP4.5 RCP6.0 RCP8.5 RCP4.5 RCP6.0 RCP8.5 (A) (C) (E) (G) (K) (I) 2040 (B) (F) (H) (D) (J) (L) 2060
Conclusions enviromis 2016 Ø The analysis of plant life-forms distribution facilitates the characterization of changes in the vegetation composition in the tropical treeline, allowing the assessment of abundance of dominant elements of forest (such as trees) on the continuous treeline in relation to other plant life-forms. Ø Temperature increments seems to be a driver factor of life-forms upslope shift within the study area,
Thank you very much for your attention! This work has been funded by Inter-American Institute for Global Change Research (IAI) through LEAF CRNII 005 project. Special thanks to Mérida Cable Car System and Instituto Nacional de Parques (INPARQUES) for allowing the access to sampling sites. Thanks to A. Heredia for his help in vegetation sampling.
Recommend
More recommend