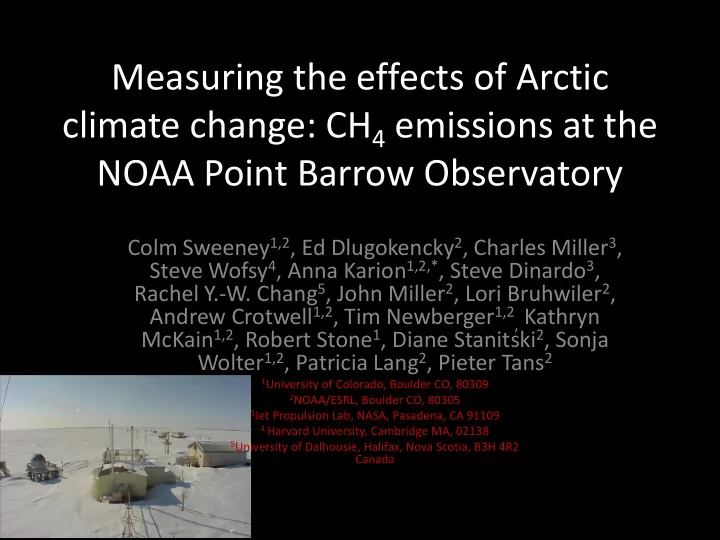

Measuring the effects of Arctic climate change: CH 4 emissions at the NOAA Point Barrow Observatory Colm Sweeney 1,2 , Ed Dlugokencky 2 , Charles Miller 3 , Steve Wofsy 4 , Anna Karion 1,2,* , Steve Dinardo 3 , Rachel Y.-W. Chang 5 , John Miller 2 , Lori Bruhwiler 2 , Andrew Crotwell 1,2 , Tim Newberger 1,2 , Kathryn McKain 1,2 , Robert Stone 1 , Diane Stanitski 2 , Sonja Wolter 1,2 , Patricia Lang 2 , Pieter Tans 2 1 University of Colorado, Boulder CO, 80309 2 NOAA/ESRL, Boulder CO, 80305 3 Jet Propulsion Lab, NASA, Pasadena, CA 91109 4 Harvard University, Cambridge MA, 02138 5 University of Dalhousie, Halifax, Nova Scotia, B3H 4R2 Canada
Evidence of rapid climate change in Arctic 0.5 °C/decade 30% decrease? Land Temperature (NASA/GISS 2015) Sea Ice Extent (NSIDC 2016)
Arctic Reservoirs >1000 PgC could be released as CH 4 or CO 2 Fossil Fuel CO 2 emitted since 1751: ~350 Pg Pg Arctic Land Vegetation: 60-80 Pg C Soil: 1200-1800 Pg C Continental Slope permafrost/hydrate Arctic Ocean floor 2-65 Pg CH 4 30-170 Pg CH 4
Barrow Observatory 1973 - Present Aerosols - insitu Meteorology – winds, temp Halocarbons – Insitu, CFC, Chloroform etc. GHG Gases – Insitu/flasks CO 2 , CH 4 , N 2 O, CO, etc. Hydrocarbons – ethane -> pentane Ozone – Insitu Radiation – albedo
Evidence of rapid climate change in Arctic August – December at BRW 0.5 °C/decade 30% decrease? Land Temperature (NASA/GISS 2015) Sea Ice Extent (NSIDC 2016) 0.5 1.2°C/decade Snow in ~20 day increase in days without snow Snow Melt Snow Cover (Stone/Stanitski)
Evidence of rapid climate change in Arctic August – December at BRW Nov - Dec at BRW 0.5 °C/decade 30% decrease? Land Temperature (NASA/GISS 2015) Sea Ice Extent (NSIDC 2016) 2.1°C/decade Snow in ~20 day increase in days without snow Snow Melt (in past 30 years) Snow Cover (Stone/Stanitski)
CH 4 at Barrow Observatory Southern Sector Southern sector shows consistent enhancement above background Background
CH 4 at Barrow Observatory Average enhancements of >70 ppb from southern sector in late summer. CH 4 enhancements Land sector Clean air sector
CH 4 at Barrow Observatory Southern Sector Mean seasonal cycle • is quite different from the background Background very • similar to other sites Background to north and south
Seasonal cycle from the North Slope Snow melt Snow fall Southern sector CH 4 Enhancement Soil T (@30 cm) Albedo Monthly means Emissions last from June through December Soil temperatures may control CH 4 emissions
CH 4 at Barrow Observatory Average enhancements of >70 ppb from southern sector in late summer. CH 4 enhancements Land sector Clean air sector
Trends in ∆ CH 4 and temperature August – December at BRW CH 4 enhancements Temperature The long term record at Barrow does not suggest that early winter (Aug-Dec) enhancements have changed over the last 29 years
Trends in ∆ CH 4 and temperature August – December at BRW CH 4 enhancements Temperature Possible CH 4 enhancement in the last 5 years in November and December
Trends in ∆ CH 4 and temperature CH 4 enhancements Possible CH 4 enhancement in the last 5 years in November and December
∆ T v. ∆ CH 4 Monthly deviation in temperature verses ∆ CH 4 5.0±3.6 ppb/C Q 10 =~2 Short-term trend: Monthly deviation in temperature trend verses enhancements in CH 4 from North Slope. Suggests significant short term response in CH 4
What is the big deal? Long Term (29 years): • Increase in T = 3.5 ± 2.3°C • Increase in 4 ± 6 ppb CH 4 = 1.1 ± 1.8 ppb CH 4 /°C Short Term (~1 month) = 5.0 ± 3.6 ppb CH 4 /°C
What is the big deal? By 2080 temperatures Arctic early winter may increase by 3- 6⁰C: Long-term response --2–17 ppb CH 4 Short-term response 15–30 ppb CH 4 = - 3 – 45% of average enhancement If current natural emissions are 19 Tg of CH 4 out of 553 Tg of CH 4 /yr: = 1.5% increase in Global emissions
Conclusions No detectable change in CH 4 despite large temperature changes - A top-down analysis of methane in the Arctic does not indicate that there is a significant trend in methane outgassing in the North Slope despite observed increases in temperature. Seasonal cycle – Starts in June and continues through December despite heavy snow accumulation well before that. Temperature sensitivity – We only see short-term correlations. Global significance – Not much (sorry!)
What is happening to the Organic Carbon “Our hydrological model simulations show that advanced ice-wedge degradation can significantly alter the water balance of lowland tundra by reducing inundation and increasing runoff” (Liljedahl et al. 2016)
What is happening to the Organic Carbon 0.02±0.008 ppm/yr 40 year ∆ CO 2 record at BRW “Our hydrological model simulations show that advanced ice-wedge degradation can significantly alter the water balance of lowland tundra by reducing inundation and increasing runoff” (Liljedahl et al. 2016)
What is happening to the Organic Carbon 0.02±0.008 ppm/yr 40 year ∆ CO 2 record at BRW “Our hydrological model simulations show that advanced ice-wedge degradation can significantly alter the water balance of lowland tundra by C org CO 2 reducing inundation and increasing runoff” (Liljedahl et al. 2016)
Conclusion • Despite large changes in climate observed at Barrow and an observed short term response in CH 4 there has been currently no significant increase in CH 4 over the last 29 years at BRW. • Even if there were a change in CH 4 emissions it would have a small impact on the global budget.
Recommend
More recommend