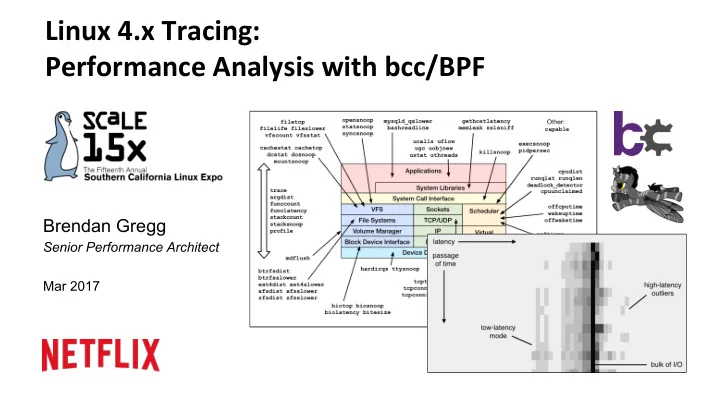
Linux 4.x Tracing: Performance Analysis with bcc/BPF Brendan Gregg - PowerPoint PPT Presentation
Linux 4.x Tracing: Performance Analysis with bcc/BPF Brendan Gregg Senior Performance Architect Mar 2017 Linux tracing in the last 3 years How do we use these superpowers? Take aways 1. Understanding the value of Linux tracing superpowers
Linux 4.x Tracing: Performance Analysis with bcc/BPF Brendan Gregg Senior Performance Architect Mar 2017
Linux tracing in the last 3 years…
How do we use these superpowers?
Take aways 1. Understanding the value of Linux tracing superpowers 2. Upgrade to Linux 4.4+ (4.9 is beDer) 3. Ask for eBPF support in your perf analysis/monitoring tools
Ye Olde BPF Berkeley Packet Filter OpVmizes packet filter # tcpdump host 127.0.0.1 and port 22 -d (000) ldh [12] performance (001) jeq #0x800 jt 2 jf 18 (002) ld [26] (003) jeq #0x7f000001 jt 6 jf 4 (004) ld [30] 2 x 32-bit registers (005) jeq #0x7f000001 jt 6 jf 18 & scratch memory (006) ldb [23] (007) jeq #0x84 jt 10 jf 8 (008) jeq #0x6 jt 10 jf 9 User-defined bytecode (009) jeq #0x11 jt 10 jf 18 executed by an in-kernel (010) ldh [20] (011) jset #0x1fff jt 18 jf 12 sandboxed virtual machine (012) ldxb 4*([14]&0xf) (013) ldh [x + 14] Steven McCanne and Van Jacobson, 1993 [...]
Enhanced BPF aka eBPF or just "BPF" 10 x 64-bit registers maps (hashes) acIons Alexei Starovoitov, 2014+
Enhanced BPF Use Cases User-Defined BPF Programs Kernel SDN ConfiguraIon RunIme Event Targets sockets DDoS MiIgaIon verifier kprobes Intrusion DetecIon uprobes BPF Container Security tracepoints BPF acVons perf_events Observability …
Enhanced BPF is in Linux
Demo
New Observability Tools • Efficient, producVon safe, useful metrics: # biolatency -mT 1 Tracing block device I/O... Hit Ctrl-C to end. 06:20:16 msecs : count distribution 0 -> 1 : 36 |**************************************| 2 -> 3 : 1 |* | 4 -> 7 : 3 |*** | 8 -> 15 : 17 |***************** | 16 -> 31 : 33 |********************************** | 32 -> 63 : 7 |******* | 64 -> 127 : 6 |****** | […] These CLI tools may be useful even if you never use them, as examples of what to implement in GUIs
New VisualizaVons and GUIs Eg, Neclix self-service UI: Flame Graphs Tracing Reports … Should be open sourced; you may also build/buy your own
Introducing enhanced BPF BPF TRACING
A Linux Tracing Timeline - 1990’s: StaVc tracers, prototype dynamic tracers - 2000: LTT + DProbes (dynamic tracing; not integrated) - 2004: kprobes (2.6.9) - 2005: DTrace (not Linux), SystemTap (out-of-tree) - 2008: irace (2.6.27) - 2009: perf_events (2.6.31) - 2009: tracepoints (2.6.32) - 2010-2016: irace & perf_events enhancements - 2012: uprobes (3.5) - 2014-2017: enhanced BPF patches: supporIng tracing events - 2016-2017: irace hist triggers also: LTTng, ktap, sysdig, ...
Linux Events & BPF Support BPF output Linux 4.7 Linux 4.9 Linux 4.4 BPF stacks Linux 4.6 Linux 4.3 Linux 4.1 (version BPF support arrived) Linux 4.9
Event Tracing Efficiency E.g., tracing TCP retransmits Kernel Old way : packet capture send 1. read tcpdump buffer 2. dump receive 1. read Analyzer 2. process file system disks 3. print New way : dynamic tracing tcp_retransmit_skb() Tracer 1. configure 2. read
BPF Tracing Internals Observability Program Kernel load staVc tracing verifier BPF BPF program bytecode tracepoints aDach dynamic tracing event config BPF kprobes uprobes per-event data async output sampling, PMCs copy perf_events maps staVsVcs
Introducing bcc BPF COMPILER COLLECTION
bcc • BPF Compiler CollecVon Tracing layers: – hDps://github.com/iovisor/bcc – Lead developer: Brenden Blanco … bcc tool bcc tool • Includes tracing tools bcc … • Provides BPF front-ends: Python lua – Python front-ends – Lua user – C++ kernel – C helper libraries Kernel – golang (gobpf) BPF Events
Raw BPF samples/bpf/sock_example.c 87 lines truncated
C/BPF samples/bpf/tracex1_kern.c 58 lines truncated
bcc/BPF (C & Python) bcc examples/tracing/bitehist.py enIre program
ply/BPF hDps://github.com/iovisor/ply/blob/master/README.md enIre program
The Tracing Landscape, Mar 2017 (my opinion) (less brutal) ply/BPF dtrace4L. ktap sysdig (many) perf Ease of use stap LTTng (hist triggers) irace recent changes bcc/BPF (mature) (alpha) C/BPF (brutal) Stage of Raw BPF Development Scope & Capability
For end-users PERFORMANCE ANALYSIS WITH BCC/BPF
Pre-BPF: Linux Perf Analysis in 60s 1. uptime 2. dmesg -T | tail 3. vmstat 1 4. mpstat -P ALL 1 5. pidstat 1 6. iostat -xz 1 7. free -m 8. sar -n DEV 1 9. sar -n TCP,ETCP 1 10. top hDp://techblog.neclix.com/2015/11/linux-performance-analysis-in-60s.html
bcc InstallaVon • hDps://github.com/iovisor/bcc/blob/master/INSTALL.md • eg, Ubuntu Xenial: # echo "deb [trusted=yes] https://repo.iovisor.org/apt/xenial xenial-nightly main" |\ sudo tee /etc/apt/sources.list.d/iovisor.list # sudo apt-get update # sudo apt-get install bcc-tools – Also available as an Ubuntu snap – Ubuntu 16.04 is good, 16.10 beDer: more tools work • Installs many tools – In /usr/share/bcc/tools, and …/tools/old for older kernels
bcc tools
bcc General Performance Checklist 1. execsnoop 2. opensnoop 3. ext4slower (…) 4. biolatency 5. biosnoop 6. cachestat 7. tcpconnect 8. tcpaccept 9. tcpretrans 10. gethostlatency 11. runqlat 12. profile
1. execsnoop • Trace new processes and debug short-lived process issues: # execsnoop PCOMM PID RET ARGS bash 15887 0 /usr/bin/man ls preconv 15894 0 /usr/bin/preconv -e UTF-8 man 15896 0 /usr/bin/tbl man 15897 0 /usr/bin/nroff -mandoc -rLL=169n -rLT=169n -Tutf8 man 15898 0 /usr/bin/pager -s nroff 15900 0 /usr/bin/locale charmap nroff 15901 0 /usr/bin/groff -mtty-char -Tutf8 -mandoc -rLL=169n ... groff 15902 0 /usr/bin/troff -mtty-char -mandoc -rLL=169n -rLT=16... groff 15903 0 /usr/bin/grotty […] Efficient: only traces exec()
2. opensnoop • Find config, log, and data files, and inefficient file usage: # opensnoop PID COMM FD ERR PATH 27159 catalina.sh 3 0 /apps/tomcat8/bin/setclasspath.sh 4057 redis-server 5 0 /proc/4057/stat 2360 redis-server 5 0 /proc/2360/stat 30668 sshd 4 0 /proc/sys/kernel/ngroups_max 30668 sshd 4 0 /etc/group 30668 sshd 4 0 /root/.ssh/authorized_keys 30668 sshd -1 2 /var/run/nologin 30668 sshd -1 2 /etc/nologin 30668 sshd 4 0 /etc/login.defs 30668 sshd 4 0 /etc/passwd […] Like "strace -feopen", but system-wide and low overhead
3. ext4slower • Trace slow FS I/O, to beDer idenVfy I/O issues and outliers: # ext4slower 1 Tracing ext4 operations slower than 1 ms TIME COMM PID T BYTES OFF_KB LAT(ms) FILENAME 06:49:17 bash 3616 R 128 0 7.75 cksum 06:49:17 cksum 3616 R 39552 0 1.34 [ 06:49:17 cksum 3616 R 96 0 5.36 2to3-2.7 06:49:17 cksum 3616 R 96 0 14.94 2to3-3.4 06:49:17 cksum 3616 R 10320 0 6.82 411toppm 06:49:17 cksum 3616 R 65536 0 4.01 a2p 06:49:17 cksum 3616 R 55400 0 8.77 ab 06:49:17 cksum 3616 R 36792 0 16.34 aclocal-1.14 […] More reliable and complete indicator than measuring disk I/O latency Also: btrfsslower, xfsslower, zfsslower
4. biolatency • IdenVfy mulVmodal latency and outliers with a histogram: # biolatency -mT 1 The "count" column is Tracing block device I/O... Hit Ctrl-C to end. summarized in-kernel 06:20:16 msecs : count distribution 0 -> 1 : 36 |**************************************| 2 -> 3 : 1 |* | 4 -> 7 : 3 |*** | 8 -> 15 : 17 |***************** | 16 -> 31 : 33 |********************************** | 32 -> 63 : 7 |******* | 64 -> 127 : 6 |****** | […] Average latency (iostat/sar) may not be represenVVve with mulVple modes or outliers
Recommend
More recommend
Explore More Topics
Stay informed with curated content and fresh updates.
