Lecture Outline Simple random sampling Statistics for Business - PowerPoint PPT Presentation
Lecture Outline Simple random sampling Statistics for Business Distribution of the sample average Large sample approximation to the distribution of the sample mean Sampling Distributions, Interval Estimation and Hypothesis Tests. Law of
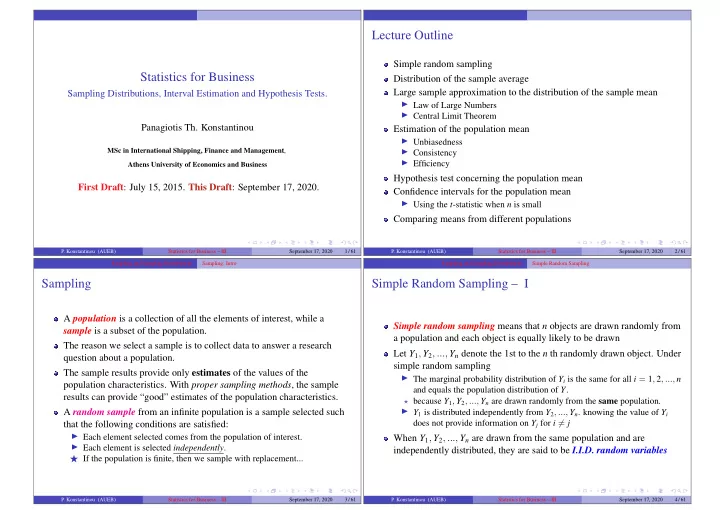
Lecture Outline Simple random sampling Statistics for Business Distribution of the sample average Large sample approximation to the distribution of the sample mean Sampling Distributions, Interval Estimation and Hypothesis Tests. ◮ Law of Large Numbers ◮ Central Limit Theorem Panagiotis Th. Konstantinou Estimation of the population mean ◮ Unbiasedness MSc in International Shipping, Finance and Management , ◮ Consistency ◮ Efficiency Athens University of Economics and Business Hypothesis test concerning the population mean First Draft : July 15, 2015. This Draft : September 17, 2020. Confidence intervals for the population mean ◮ Using the t -statistic when n is small Comparing means from different populations P. Konstantinou (AUEB) Statistics for Business – III September 17, 2020 1 / 61 P. Konstantinou (AUEB) Statistics for Business – III September 17, 2020 2 / 61 Sampling and Sampling Distributions Sampling: Intro Sampling and Sampling Distributions Simple Random Sampling Sampling Simple Random Sampling – I A population is a collection of all the elements of interest, while a Simple random sampling means that n objects are drawn randomly from sample is a subset of the population. a population and each object is equally likely to be drawn The reason we select a sample is to collect data to answer a research Let Y 1 , Y 2 , ..., Y n denote the 1st to the n th randomly drawn object. Under question about a population. simple random sampling The sample results provide only estimates of the values of the ◮ The marginal probability distribution of Y i is the same for all i = 1 , 2 , ..., n population characteristics. With proper sampling methods , the sample and equals the population distribution of Y . results can provide “good” estimates of the population characteristics. ⋆ because Y 1 , Y 2 , ..., Y n are drawn randomly from the same population. A random sample from an infinite population is a sample selected such ◮ Y 1 is distributed independently from Y 2 , ..., Y n . knowing the value of Y i does not provide information on Y j for i � = j that the following conditions are satisfied: ◮ Each element selected comes from the population of interest. When Y 1 , Y 2 , ..., Y n are drawn from the same population and are ◮ Each element is selected independently . independently distributed, they are said to be I.I.D. random variables ⋆ If the population is finite, then we sample with replacement... P. Konstantinou (AUEB) Statistics for Business – III September 17, 2020 3 / 61 P. Konstantinou (AUEB) Statistics for Business – III September 17, 2020 4 / 61
Sampling and Sampling Distributions Simple Random Sampling Sampling and Sampling Distributions Sampling Distribution of the Sample Average Simple Random Sampling – II The Sampling Distribution of the Sample Average – I The sample average ¯ Y of a randomly drawn sample is a random variable Example with a probability distribution called the sampling distribution Let G be the gender of an individual ( G = 1 if female, G = 0 if male) n Y = 1 n ( Y 1 + Y 2 + · · · + Y n ) = 1 � G is a Bernoulli r.v. with E ( G ) = µ G = Pr( G = 1 ) = 0 . 5 ¯ Y i n Suppose we take the population register and randomly draw a sample of i = 1 size n ◮ The individuals in the sample are drawn at random. ◮ The probability distribution of G i is a Bernoulli with mean 0 . 5 ◮ Thus the values of ( Y 1 , Y 2 , · · · , Y n ) are random ◮ G 1 is distributed independently from G 2 , ..., G n ◮ Thus functions of ( Y 1 , Y 2 , · · · , Y n ), such as ¯ Y , are random: had a different Suppose we draw a random sample of individuals entering the building sample been drawn, they would have taken on a different value of the accounting department ◮ The distribution of over different possible samples of size n is called the sampling distribution of ¯ ◮ This is not a sample obtained by simple random sampling and Y . G 1 , G 2 , ..., G n are not i.i.d ◮ The mean and variance of are the mean and variance of its sampling distribution, E (¯ Y ) and Var (¯ ◮ Men are more likely to enter the building of the accounting department! Y ) . ◮ The concept of the sampling distribution underpins all of statistics/econometrics. P. Konstantinou (AUEB) Statistics for Business – III September 17, 2020 5 / 61 P. Konstantinou (AUEB) Statistics for Business – III September 17, 2020 6 / 61 Sampling and Sampling Distributions Sampling Distribution of the Sample Average Sampling and Sampling Distributions Sampling Distribution of the Sample Average The Sampling Distribution of the Sample Average – II The Sampling Distribution of the Sample Average – III Example n Y = 1 n ( Y 1 + Y 2 + · · · + Y n ) = 1 � ¯ Y i Let G be the gender of an individual ( G = 1 if female, G = 0 if male) n i = 1 The mean of the population distribution of G is Suppose that Y 1 , Y 2 , ..., Y n are I.I.D. and the mean & variance of the population distribution of Y are respectively µ Y and σ 2 E ( G ) = µ G = Pr( G = 1 ) = p = 0 . 5 Y ◮ The mean of (the sampling distribution of) ¯ Y is The variance of the population distribution of G is � � n n 1 = 1 E ( Y i ) = 1 � � E (¯ Y ) = E nn E ( Y ) = µ Y Y i Var ( G ) = σ 2 G = p ( 1 − p ) = 0 . 5 ( 1 − 0 . 5 ) = 0 . 25 n n i = 1 i = 1 ◮ The variance of (the sampling distribution of) ¯ The mean and variance of the average gender (proportion of women) ¯ Y is G in a random sample with n = 10 are � � n n n n 1 = 1 Var ( Y i ) + 2 1 � � � � Var (¯ Y ) = Var Cov ( Y i , Y j ) Y i n 2 n 2 n E (¯ G ) = µ G = 0 . 5 i = 1 i = 1 i = 1 j = 1 , j � = i n Var ( Y ) = σ 2 1 G = 1 n 2 n Var ( Y ) + 0 = 1 1 Var (¯ n σ 2 Y G ) = 100 . 25 = 0 . 025 = n P. Konstantinou (AUEB) Statistics for Business – III September 17, 2020 7 / 61 P. Konstantinou (AUEB) Statistics for Business – III September 17, 2020 8 / 61
Sampling and Sampling Distributions Sampling Distribution of the Sample Average Sampling and Sampling Distributions Sampling Distribution of the Sample Average The Sampling Distribution of the Average Gender ¯ The Finite-Sample Distribution of the Sample Average G Suppose G takes on 0 or 1 (a Bernoulli random variable) with the probability distribution The finite sample distribution is the sampling distribution that exactly Pr( G = 0 ) = p = 0 . 5 , Pr( G = 1 ) = 1 − p = 0 . 5 describes the distribution of ¯ Y for any sample size n . In general the exact sampling distribution of ¯ Y is complicated and As we discussed above: depends on the population distribution of Y . E ( G ) = µ G = Pr( G = 1 ) = p = 0 . 5 A special case is when Y 1 , Y 2 , ..., Y n are IID draws from the N ( µ Y , σ 2 Y ) , σ 2 Var ( G ) = G = p ( 1 − p ) = 0 . 5 ( 1 − 0 . 5 ) = 0 . 25 because in this case � � µ Y , σ 2 ¯ Y Y ∼ N The sampling distribution of ¯ G depends on n . n Consider n = 2. The sampling distribution of ¯ G is G = 0 ) = 0 . 5 2 = 0 . 25 ◮ Pr(¯ ◮ Pr(¯ G = 1 / 2 ) = 2 × 0 . 5 × ( 1 − 0 . 5 ) = 0 . 5 G = 1 ) = ( 1 − 0 . 5 ) 2 = 0 . 25 ◮ Pr(¯ P. Konstantinou (AUEB) Statistics for Business – III September 17, 2020 9 / 61 P. Konstantinou (AUEB) Statistics for Business – III September 17, 2020 10 / 61 Sampling and Sampling Distributions Sampling Distribution of the Sample Average Sampling and Sampling Distributions Asymptotic Approximations The Finite-Sample Distribution of the Average Gender ¯ The Asymptotic Distribution of the Sample Average ¯ G Y Suppose we draw 999 samples of n = 2: · · · Sample 1 Sample 1 Sample 3 Sample 999 Given that the exact sampling distribution of ¯ Y is complicated and given ¯ ¯ ¯ ¯ G 1 G 2 G G 1 G 2 G G 1 G 2 G G 1 G 2 G that we generally use large samples in statistics/econometrics we will 0 . 5 0 . 5 1 0 1 1 1 0 1 0 0 0 often use an approximation of the sample distribution that relies on the sample being large Sample distribution of average gender 999 samples of n=2 The asymptotic distribution or large-sample distribution is the .5 approximate sampling distribution of ¯ Y if the sample size becomes very .4 large: n → ∞ . probability We will use two concepts to approximate the large-sample distribution of .3 the sample average .2 ◮ The law of large numbers. ◮ The central limit theorem. .1 0 0 .2 .4 .5 .6 .8 1 sample average . P. Konstantinou (AUEB) Statistics for Business – III September 17, 2020 11 / 61 P. Konstantinou (AUEB) Statistics for Business – III September 17, 2020 12 / 61
Recommend


More recommend
Explore More Topics
Stay informed with curated content and fresh updates.