Lecture 10: Performance Tools Abhinav Bhatele, Department of - PowerPoint PPT Presentation
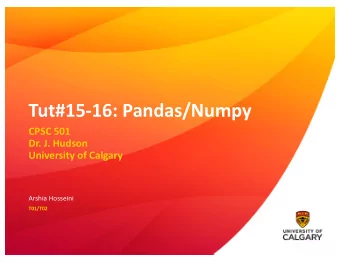
Introduction to Parallel Computing (CMSC498X / CMSC818X) Lecture 10: Performance Tools Abhinav Bhatele, Department of Computer Science Announcements Quiz 1 has been posted Deadline: October 1, 11:59 pm AoE Department seminar tomorrow
Introduction to Parallel Computing (CMSC498X / CMSC818X) Lecture 10: Performance Tools Abhinav Bhatele, Department of Computer Science
Announcements • Quiz 1 has been posted • Deadline: October 1, 11:59 pm AoE • Department seminar tomorrow at 11:00 am • Zoom link forwarded by e-mail Abhinav Bhatele (CMSC498X/CMSC818X) LIVE RECORDING 2
Performance analysis • Parallel performance of a program might not be what the developer expects • How do we find performance bottlenecks? • Two parts to performance analysis: measurement and analysis/visualization • Simplest tool: timers in the code and printf Abhinav Bhatele (CMSC498X/CMSC818X) LIVE RECORDING 3
Using timers double start, end; double phase1, phase2, phase3; start = MPI_Wtime(); ... phase1 code ... end = MPI_Wtime(); phase1 = end - start; start = MPI_Wtime(); ... phase2 ... end = MPI_Wtime(); phase2 = end - start; start = MPI_Wtime(); ... phase3 ... end = MPI_Wtime(); phase3 = end - start; Abhinav Bhatele (CMSC498X/CMSC818X) LIVE RECORDING 4
Using timers double start, end; double phase1, phase2, phase3; start = MPI_Wtime(); ... phase1 code ... Phase 1 took 2.45 s end = MPI_Wtime(); phase1 = end - start; Phase 2 took 11.79 s start = MPI_Wtime(); ... phase2 ... Phase 3 took 4.37 s end = MPI_Wtime(); phase2 = end - start; start = MPI_Wtime(); ... phase3 ... end = MPI_Wtime(); phase3 = end - start; Abhinav Bhatele (CMSC498X/CMSC818X) LIVE RECORDING 4
Performance tools • Tracing tools • Capture entire execution trace • Profiling tools • Provide aggregated information • Typically use statistical sampling • Many tools can do both Abhinav Bhatele (CMSC498X/CMSC818X) LIVE RECORDING 5
Metrics recorded • Counts of function invocations • Time spent in code • Number of bytes sent • Hardware counters • To fix performance problems — we need to connect metrics to source code Abhinav Bhatele (CMSC498X/CMSC818X) LIVE RECORDING 6
Tracing tools • Record all the events in the program with timestamps • Events: function calls, MPI events, etc. Vampir visualization: https://hpc.llnl.gov/software/development-environment-software/vampir-vampir-server Abhinav Bhatele (CMSC498X/CMSC818X) LIVE RECORDING 7
Tracing tools • Record all the events in the program with timestamps • Events: function calls, MPI events, etc. Vampir visualization: https://hpc.llnl.gov/software/development-environment-software/vampir-vampir-server Abhinav Bhatele (CMSC498X/CMSC818X) LIVE RECORDING 7
Tracing tools • Record all the events in the program with timestamps • Events: function calls, MPI events, etc. Vampir visualization: https://hpc.llnl.gov/software/development-environment-software/vampir-vampir-server Abhinav Bhatele (CMSC498X/CMSC818X) LIVE RECORDING 7
Examples of tracing tools • VampirTrace • Score-P • TAU • Projections • HPCToolkit Abhinav Bhatele (CMSC498X/CMSC818X) LIVE RECORDING 8
Profiling tools • Ignore the specific times at which events occurred • Provide aggregate information about different parts of the code • Examples: • Gprof, perf • mpiP Gprof data in hpctView • HPCToolkit, caliper • Python tools: cprofile, pyinstrument, scalene Abhinav Bhatele (CMSC498X/CMSC818X) LIVE RECORDING 9
Calling contexts, trees, and graphs • Calling context or call path: Sequence of function invocations main leading to the current sample physics solvers • Calling context tree (CCT): dynamic prefix tree of all call paths in an execution mpi hypre mpi • Call graph: merge nodes in a CCT with the same name into psm2 psm2 a single node but keep caller-callee relationships as arcs Abhinav Bhatele (CMSC498X/CMSC818X) LIVE RECORDING 10
Calling context trees, call graphs, … foo bar qux waldo baz grault quux fred garply corge plugh xyzzy bar grault garply thud baz grault baz garply Calling context tree (CCT) Abhinav Bhatele (CMSC498X/CMSC818X) LIVE RECORDING 11
Calling context trees, call graphs, … foo bar qux waldo baz grault quux fred garply corge plugh xyzzy bar grault garply thud baz grault baz garply Calling context tree (CCT) Abhinav Bhatele (CMSC498X/CMSC818X) LIVE RECORDING 11
Calling context trees, call graphs, … Contextual information foo File Line number bar qux waldo Function name Callpath baz grault quux fred garply Load module Process ID Thread ID corge plugh xyzzy bar grault garply thud baz grault baz garply Calling context tree (CCT) Abhinav Bhatele (CMSC498X/CMSC818X) LIVE RECORDING 11
Calling context trees, call graphs, … Contextual information foo File Line number bar qux waldo Function name Callpath baz grault quux fred garply Load module Process ID Thread ID corge plugh xyzzy Performance Metrics bar grault garply thud Time Flops baz grault baz garply Cache misses Calling context tree (CCT) Abhinav Bhatele (CMSC498X/CMSC818X) LIVE RECORDING 11
Calling context trees, call graphs, … Contextual information foo foo File Line number qux waldo bar qux waldo Function name Callpath quux fred baz grault quux fred garply Load module Process ID Thread ID corge plugh xyzzy corge plugh xyzzy Performance Metrics bar thud bar grault garply thud Time Flops baz grault baz garply grault baz garply Cache misses Calling context tree (CCT) Call graph Abhinav Bhatele (CMSC498X/CMSC818X) LIVE RECORDING 11
Recommend
More recommend
Explore More Topics
Stay informed with curated content and fresh updates.


