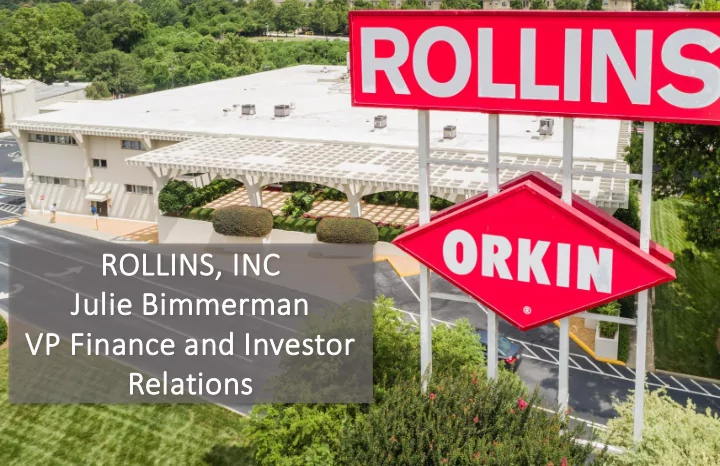

ROLLINS, INC Julie Bimmerman VP Finance and Investor Re Relations
The Rolli llins Brand Continued Growth Our Company Ou • • 22 consecutive years of improved earnings Leading pest and termite control company • • Powerful ORKIN brand name – world renown Dividend increased a minimum of 12% for 17 • consecutive years Over 2.3 million residential and commercial • 5% or greater revenue growth each of the last 10 customers • years Over 800 locations and 200 franchises worldwide 2
Key Events in in Our His istory ry 1901 Orkin began operations; Otto Orkin “The Rat Man” sold poison door to door 1964 Rollins buys Orkin for $62 million 1968 Rollins begins trading on the NYSE 1999 Orkin acquires Canadian Based PCO Services Entry into International Market 2015 Rollins acquires Critter Control, Inc. 2019 Rollins acquires Clark Pest Control 3
A A FAM AMILY OF OF BRANDS 4
Industry In ry Awareness Customers Growth Mar arket $ 18 billion industry globally with an Increasing health US market is 20,000 US, roughly 70% residential expected growth rate of 4-5% companies; Highly fragmented awareness US and 30% commercial annually; $12+ billion US market Com ompetit itors Evolu lutio tion 3 largest public competitors: Rollins, Terminix, Rentokil, Anticimex ServiceMaster (NYSE:SERV) & Ecolab generate over 30% of Rentokil (LSE:RTO) industry revenues 5 Ecolab (NYSE:ECL)
Solid track record of Shareholder Value creation Roll llin ins Valu alue Proposit ition Com ompetit itiv ive Advantage Brand and best in class customer experience Recessio ion Resis istant 80+% of revenues are recurring Signifi ificant Ins nsid ider Own wnership ip Strong management and excellent depth Str trong Bala alance She heet Focus on sustained profitable growth 6
Revenue & Retention by y Busi siness Lin Line 1% 45% 17% 37% Com ommercial Residentia tial Termit ite Other Retention 88% - 90% Retention 76% - 85% Retention approximately 85% 7
Revenue Gr Growth 2009 2009-2018 2018 $1,900,000,000 $1,750,000,000 $1,600,000,000 $1,450,000,000 $1,300,000,000 $1,150,000,000 $1,000,000,000 8
Organic ic Revenue Gr Growth 6.0% 5.0% 4.0% 3.0% 2.0% 1.0% 0.0% 2014 2015 2016 2017 2018 2019 Q1 Q2 Q3 Q4 9
People – Our Gr Greatest Ass sset 10
Commitment to Train aining 27,000 sq. ft. state of the art Named to Training Magazine Learning & Training Center Attracts regulators, “Top 125 Training unique to pest control educators, & university Companies” for the past 13 industry, including Termite & researchers years Commercial training facility 11
Glo Global Trai aining Communication Web-based employee training network utilized by employees and franchises worldwide 12
Global Stra rate tegic Fra ranchises 23 North & South America 49 Orkin Domestic Franchises Wor orld ldwide 34 Europe & Asia 94 Orkin International Franchises 1 Australia 10 Orkin Australia Franchises 5 Africa 83 Critter Control Franchises 63 Total Countries 236 Total Franchises Europe • Netherlands • Ireland • Portugal • Kazakhstan North America • Romania • Cyprus • Turkey • Moscow Central America • Cote d Azure • Mexico • Budapest • Guatemala Middle East • East Asia El Salvador • Honduras • South Korea • South America Saudi Arabia • Nicaragua • China • Brazil • • Bahrain Costa Rica • Kingdom of Cambodia • • Ecuador Lebanon • Panama • Mongolia • Columbia • Kuwait • Macau Africa • • Peru Qatar • Hong Kong South Asia • Nigeria • • Uruguay Oman • India Caribbean • Egypt • Chile • Azerbaijan • Pakistan • • Jamaica Kenya • • Paraguay Kurdistan • Malaysia • • Turks & Caicos Côte d’Ivoire • Oceania Bolivia • Georgia Australia • Indonesia • Islands Libia • • Argentina • United Arab Guam • • Bangladesh Trinidad & Tobago Emirates • US Virgin Islands • Puerto Rico • St. Lucia Countries with Company owned operations • Cayman Islands 13
Technology BOS BOSS – Br Branch Op Operating Su Support System 14
Technology Vi Virtual l Route Management 15
Technology Bi BizSuite, , InS InSite 16
Ne Net In Income 2009 2009-2018 2018 $240,000,000 $220,000,000 $200,000,000 Average Growth Rate = $180,000,000 12.9% (11.6% Adj for Tax) $160,000,000 $140,000,000 $120,000,000 $100,000,000 $80,000,000 $60,000,000 17
Strong Fr Str Free Cash ash Flo Flows Gr Growth $180.00 $152.7 $160.00 $140.00 $122.0 $120.00 $109.0 $107.1 $100.00 $91.8 $89.7 $90.1 $84.4 $75.8 $80.00 $65.1 $60.00 $39.5 $33.1 $40.00 $28.7 $27.1 $24.7 $20.00 $0.00 2014 2015 2016 2017 2018 Capital Expenditures Dividend Payout Free Cash Flow 18
Divid Di idend Record $0.50 $0.47 Increase at 12.5% or more in the $0.45 past 17 years $0.38 $0.40 $0.37 $0.34 $0.35 $0.31 $0.28 $0.30 $0.27 $0.23 $0.25 $0.21 $0.18 $0.20 $0.15 $0.10 $0.05 $0.00 2014 2015 2016 2017 2018 Dividends Paid (excluding special dividends) Dividends Paid (with special dividends) All dividend data is presented post-split for the three-for-two stock split effective March 10, 2015 and November 9, 2018 for shareholders of record February 10, 2015 and December 10, 19 2018.
Growth and th the e Futu ture of of Rolli ollins 20
Su Sustainabili ility Mis issi sion At Rollins, we are committed to sustaining our people and communities, our environment, and our business. 21
Thank You For questions, please reach out to Julie Bimmerman Julie Bimmerman VP, Finance and Investor Relations (404) 888-2000 jbimmerman@rollins.com Telephone Location Website 404-888-2000 2170 Piedmont Rd, NE www.rollins.com Atlanta, GA 30324 investorrelations@rollins.com United States Updated: 11.01.19
Recommend
More recommend