Java Performance Analysis on Linux with Flame Graphs Brendan Gregg - PowerPoint PPT Presentation
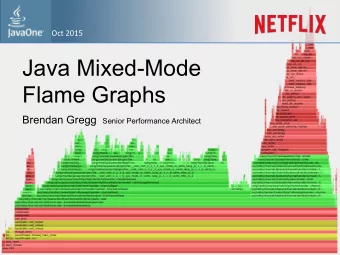
Sep 2016 Java Performance Analysis on Linux with Flame Graphs Brendan Gregg Senior Performance Architect Complete Visibility Java Mixed-Mode Flame Graph via Linux perf_events Java C C++ (User) (JVM) Java C (Inlined) (Kernel) Cloud
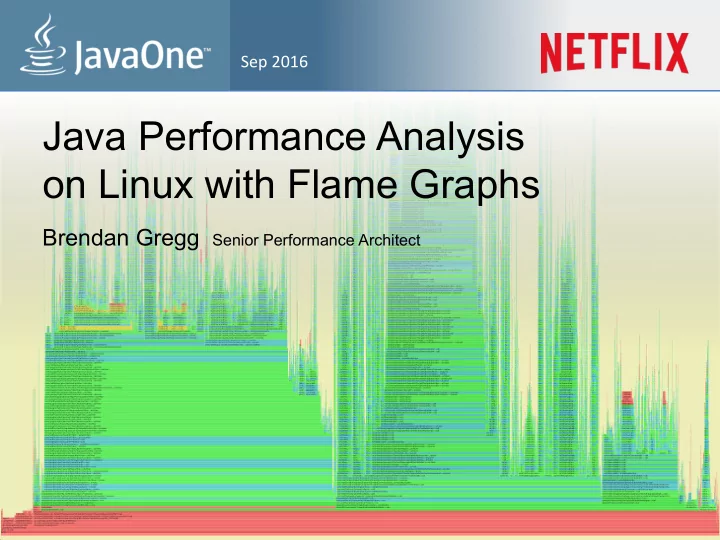
Sep 2016 Java Performance Analysis on Linux with Flame Graphs Brendan Gregg Senior Performance Architect
Complete Visibility Java Mixed-Mode Flame Graph via Linux perf_events Java C C++ (User) (JVM) Java C (Inlined) (Kernel)
Cloud • Tens of thousands of AWS EC2 instances • Mostly Java (Oracle JVM) Auto Scaling Group Instance: usually Ubuntu Linux Scaling Policy OpJonal Apache, Java (JDK 8) loadavg, memcached, CloudWatch, servo latency, … Node.js, … GC and Tomcat thread dump Atlas, Vector, S3 logging Instance logs, sar, trace, Instance perf, perf-tools, hystrix, servo (BPF soon) Instance
The Problem with Profilers
Java Profilers Kernel, libraries, JVM Java GC
Java Profilers • Visibility – Java method execution – Object usage – GC logs – Custom Java context • Typical problems: – Sampling often happens at safety/yield points (skew) – Method tracing has massive observer effect – Misidentifies RUNNING as on-CPU (e.g., epoll) – Doesn't include or profile GC or JVM CPU time – Tree views not quick (proportional) to comprehend • Inaccurate (skewed) and incomplete profiles
System Profilers Kernel Java TCP/IP JVM GC epoll Locks Idle Time thread
System Profilers • Visibility – JVM (C++) – GC (C++) – libraries (C) – kernel (C) • Typical problems (x86): – Stacks missing for Java – Symbols missing for Java methods • Other architectures (e.g., SPARC) have fared better • Profile everything except Java
Workaround • Capture both: Java System • An improvement, but system stacks are missing Java context, and therefore hard to interpret
Solution Java Mixed-Mode Flame Graph Kernel Java JVM GC
Solution • Fix system profiling, see everything: Kernel – Java methods Java – JVM (C++) JVM GC – GC (C++) – libraries (C) – kernel (C) – Other apps • Minor Problems: – 0-3% CPU overhead to enable frame pointers (usually <1%). – Symbol dumps can consume a burst of CPU • Complete and accurate (asynchronous) profiling
Saving 13M CPU Minutes Per Day • eu hXp://techblog.neZlix.com/2016/04/saving-13-million-computaJonal-minutes.html
System Example Exception handling consuming CPU
Profiling GC GC internals, visualized:
CPU Profiling
CPU Profiling • Record stacks at a timed interval: simple and effective – Pros: Low (deterministic) overhead – Cons: Coarse accuracy, but usually sufficient stack B B samples: A A A A A syscall B A time on-CPU off-CPU block interrupt
Stack Traces • A code path snapshot. e.g., from jstack(1): $ jstack 1819 […] "main" prio=10 tid=0x00007ff304009000 nid=0x7361 runnable [0x00007ff30d4f9000] java.lang.Thread.State: RUNNABLE running at Func_abc.func_c(Func_abc.java:6) parent at Func_abc.func_b(Func_abc.java:16) g.parent at Func_abc.func_a(Func_abc.java:23) g.g.parent at Func_abc.main(Func_abc.java:27)
System Profilers • Linux – perf_events (aka "perf") • Oracle Solaris – DTrace • OS X – Instruments • Windows – XPerf, WPA (which now has flame graphs!) • And many others …
Linux perf_events • Standard Linux profiler – Provides the perf command (multi-tool) – Usually pkg added by linux-tools-common, etc. • Many event sources: – Timer-based sampling – Hardware events – Tracepoints – Dynamic tracing • Can sample stacks of (almost) everything on CPU – Can miss hard interrupt ISRs, but these should be near-zero. They can be measured if needed (I wrote my own tools)
perf Profiling # perf record -F 99 -ag -- sleep 30 [ perf record: Woken up 9 times to write data ] [ perf record: Captured and wrote 2.745 MB perf.data (~119930 samples) ] # perf report -n -stdio […] # Overhead Samples Command Shared Object Symbol # ........ ............ ....... ................. ............................. # 20.42% 605 bash [kernel.kallsyms] [k] xen_hypercall_xen_version | --- xen_hypercall_xen_version call tree check_events summary | |--44.13%-- syscall_trace_enter | tracesys | | | |--35.58%-- __GI___libc_fcntl | | | | | |--65.26%-- do_redirection_internal | | | do_redirections | | | execute_builtin_or_function | | | execute_simple_command [… ~13,000 lines truncated …]
Full perf report Output
… as a Flame Graph
Flame Graphs • Flame Graphs: – x-axis : alphabetical stack sort, to maximize merging – y-axis : stack depth – color : random (default), or a dimension • Currently made from Perl + SVG + JavaScript – Multiple d3 versions are being developed • References: – http://www.brendangregg.com/FlameGraphs/cpuflamegraphs.html – http://queue.acm.org/detail.cfm?id=2927301 – "The Flame Graph" CACM, June 2016 • Easy to make – Converters for many profilers
Flame Graph Interpretation g() e() f() d() c() i() b() h() a()
Flame Graph Interpretation (1/3) Top edge shows who is running on-CPU, and how much (width) g() e() f() d() c() i() b() h() a()
Flame Graph Interpretation (2/3) Top-down shows ancestry e.g., from g(): g() e() f() d() c() i() b() h() a()
Flame Graph Interpretation (3/3) Widths are proportional to presence in samples e.g., comparing b() to h() (incl. children) g() e() f() d() c() i() b() h() a()
Mixed-Mode Flame Graphs • Hues: Mixed-Mode – green == Java – aqua == Java (inlined) Kernel • if included Java JVM – red == system – yellow == C++ • Intensity: – Randomized to differentiate frames – Or hashed on function name
Differential Flame Graphs • Hues: Differential – red == more samples – blue == less samples • Intensity: – Degree of difference • Compares two profiles • Can show other more less metrics: e.g., CPI • Other types exist – flamegraphdiff
Flame Graph Search • Color: magenta to show matched frames search button
Flame Charts • Final note: these are useful, but are not flame graphs • Flame charts : x-axis is time • Flame graphs : x-axis is population (maximize merging)
Stack Tracing
Broken Java Stacks on x86 • These stacks are # perf record –F 99 –a –g – sleep 30 # perf script 1 or 2 levels deep, […] java 4579 cpu-clock: with junk values 7f417908c10b [unknown] (/tmp/perf-4458.map) • On x86 (x86_64), java 4579 cpu-clock: hotspot uses the 7f41792fc65f [unknown] (/tmp/perf-4458.map) frame pointer a2d53351ff7da603 [unknown] ([unknown]) […] register (RBP) as general purpose • This "compiler optimization" breaks (RBP-based) stack walking Once upon a tj me , x86 had fewer registers, and this made more • sense • gcc provides -fno-omit-frame-pointer to avoid doing this, but the JVM had no such option …
… as a Flame Graph Broken Java stacks (missing frame pointer)
Fixing Stack Walking Possibilities: A. Fix frame pointer-based stack walking (the default) – Pros: simple, supported by many tools – Cons: might cost a little extra CPU B. Use a custom walker (likely needing kernel support) – Pros: full stack walking (incl. inlining) & arguments – Cons: custom kernel code, can cost more CPU when in use C. Try libunwind and DWARF – Even feasible with JIT? Our current preference is (A)
-XX:+PreserveFramePointer • I hacked OpenJDK x86_64 to support frame pointers – Taking RBP out of register pools, and adding function prologues. It worked, I shared the patch. – It became JDK-8068945 for JDK 9 and JDK-8072465 for JDK 8 • Zoltán Majó (Oracle) rewrote it, and it is now: – -XX:+PreserveFramePointer in JDK 9 and JDK 8 u60b19 – Thanks to Zoltán, Oracle, and the other hotspot engineers for helping get this done! • It might cost 0 – 3% CPU, depending on workload
Recommend
More recommend
Explore More Topics
Stay informed with curated content and fresh updates.
