Java Mixed-Mode Flame Graphs Brendan Gregg Senior Performance - PowerPoint PPT Presentation
Oct 2015 Java Mixed-Mode Flame Graphs Brendan Gregg Senior Performance Architect Understanding Java CPU usage quickly and completely Quickly Via SSH and open source tools (covered in this talk) Or using Netflix Vector GUI (also
Oct ¡2015 ¡ Java Mixed-Mode Flame Graphs Brendan Gregg Senior Performance Architect
Understanding Java CPU usage quickly and completely
Quickly • Via SSH and open source tools (covered in this talk) • Or using Netflix Vector GUI (also open source): 1. Observe high CPU usage 2. Generate a flame graph
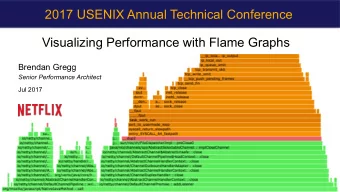
Completely Java Mixed-Mode Flame Graph via Linux perf_events: Kernel Java JVM GC
Messy House Fallacy Fallacy : ¡my ¡code ¡is ¡a ¡mess, ¡I ¡bet ¡yours ¡is ¡ immaculate, ¡therefore ¡the ¡bug ¡must ¡be ¡mine ¡ ¡ Reality : ¡everyone's ¡code ¡is ¡terrible ¡and ¡buggy ¡ • Don't overlook system code: kernel, libraries, etc.
Context
• Over 60 million subscribers – Just launched in Spain! • AWS EC2 Linux cloud • FreeBSD CDN • Awesome place to work
Cloud • Tens of thousands of AWS EC2 instances • Mostly running Java applications (Oracle JVM) Linux ¡(usually ¡Ubuntu) ¡ OpMonal ¡Apache, ¡ Java ¡(JDK ¡8) ¡ memcached, ¡Node.js, ¡ … ¡ GC ¡and ¡ Tomcat ¡ thread ¡ ApplicaMon ¡war ¡files, ¡ dump ¡ Atlas, ¡S3 ¡log ¡rotaMon, ¡ plaYorm, ¡base ¡servlet ¡ logging ¡ sar, ¡Trace, ¡perf, ¡stap, ¡ perf-‑tools ¡ hystrix, ¡metrics ¡(Servo), ¡ health ¡check ¡ Vector, ¡pcp ¡
Why we need CPU profiling • Improving performance Auto ¡Scaling ¡ – Identify tuning targets Group ¡ – Incident response Scaling ¡Policy ¡ – Non-regression testing loadavg, ¡latency, ¡… ¡ CloudWatch, ¡Servo ¡ – Software evaluations ¡ – CPU workload characterization • Cost savings Instance ¡ – ASGs often scale on load Instance ¡ average (CPU), so CPU usage is proportional to cost Instance ¡
The Problem with Profilers
Java Profilers Kernel, libraries, JVM Java GC
Java Profilers • Visibility – Java method execution – Object usage – GC logs – Custom Java context • Typical problems: – Sampling often happens at safety/yield points (skew) – Method tracing has massive observer effect – Misidentifies RUNNING as on-CPU (e.g., epoll) – Doesn't include or profile GC or JVM CPU time – Tree views not quick (proportional) to comprehend • Inaccurate (skewed) and incomplete profiles
System Profilers Kernel Java TCP/IP JVM GC epoll Locks Idle Time thread
System Profilers • Visibility – JVM (C++) – GC (C++) – libraries (C) – kernel (C) • Typical problems (x86): – Stacks missing for Java – Symbols missing for Java methods • Other architectures (e.g., SPARC) have fared better • Profile everything except Java
Workaround • Capture both Java and system profiles, and examine side by side Java System • An improvement, but Java context is often crucial for interpreting system profiles
Solution Java Mixed-Mode Flame Graph Kernel Java JVM GC
Solution • Fix system profiling – Only way to see it all Kernel • Visibility is everything: Java JVM GC – Java methods – JVM (C++) – GC (C++) – libraries (C) – kernel (C) • Minor Problems: – 0-3% CPU overhead to enable frame pointers (usually <1%). – Symbol dumps can consume a burst of CPU • Complete and accurate (asynchronous) profiling
Simple Production Example 1. Poor performance, and one CPU at 100% 2. perf_events flame graph shows JVM stuck compiling
Another System Example Exception handling consuming CPU
DEMO FlameGraph_tomcat01.svg
Exonerating The System • From last week: - Frequent thread creation/ destruction assumed to be consuming CPU resources. Recode application? - A flame graph quantified this CPU time: near zero - Time mostly other Java methods
Profiling GC GC internals, visualized:
CPU Profiling
CPU Profiling • Record stacks at a timed interval: simple and effective – Pros: Low (deterministic) overhead – Cons: Coarse accuracy, but usually sufficient stack B B samples: A A A A A syscall B A time on-CPU off-CPU block interrupt
Stack Traces • A code path snapshot. e.g., from jstack(1): $ jstack 1819 […] "main" prio=10 tid=0x00007ff304009000 nid=0x7361 runnable [0x00007ff30d4f9000] java.lang.Thread.State: RUNNABLE running running at Func_abc.func_c(Func_abc.java:6) parent at Func_abc.func_b(Func_abc.java:16) codepath g.parent at Func_abc.func_a(Func_abc.java:23) start g.g.paren at Func_abc.main(Func_abc.java:27)
System Profilers • Linux – perf_events (aka "perf") • Oracle Solaris – DTrace • OS X – Instruments • Windows – XPerf • And many others …
Linux perf_events • Standard Linux profiler – Provides the perf command (multi-tool) – Usually pkg added by linux-tools-common, etc. • Features: – Timer-based sampling – Hardware events – Tracepoints – Dynamic tracing • Can sample stacks of (almost) everything on CPU – Can miss hard interrupt ISRs, but these should be near-zero. They can be measured if needed (I wrote my own tools)
perf record Profiling • Stack profiling on all CPUs at 99 Hertz, then dump: # perf record -F 99 -ag -- sleep 30 [ perf record: Woken up 9 times to write data ] [ perf record: Captured and wrote 2.745 MB perf.data (~119930 samples) ] # perf script […] bash 13204 cpu-clock: 459c4c dequote_string (/root/bash-4.3/bash) 465c80 glob_expand_word_list (/root/bash-4.3/bash) 466569 expand_word_list_internal (/root/bash-4.3/bash) 465a13 expand_words (/root/bash-4.3/bash) 43bbf7 execute_simple_command (/root/bash-4.3/bash) one 435f16 execute_command_internal (/root/bash-4.3/bash) 435580 execute_command (/root/bash-4.3/bash) stack 43a771 execute_while_or_until (/root/bash-4.3/bash) sample 43a636 execute_while_command (/root/bash-4.3/bash) 436129 execute_command_internal (/root/bash-4.3/bash) 435580 execute_command (/root/bash-4.3/bash) 420cd5 reader_loop (/root/bash-4.3/bash) 41ea58 main (/root/bash-4.3/bash) 7ff2294edec5 __libc_start_main (/lib/x86_64-linux-gnu/libc-2.19.so) [… ~47,000 lines truncated …]
perf report Summary • Generates a call tree and combines samples: # perf report -n -stdio […] # Overhead Samples Command Shared Object Symbol # ........ ............ ....... ................. ............................. # 20.42% 605 bash [kernel.kallsyms] [k] xen_hypercall_xen_version | --- xen_hypercall_xen_version call tree check_events | summary |--44.13%-- syscall_trace_enter | tracesys | | | |--35.58%-- __GI___libc_fcntl | | | | | |--65.26%-- do_redirection_internal | | | do_redirections | | | execute_builtin_or_function | | | execute_simple_command [… ~13,000 lines truncated …]
Flame Graphs
perf report Verbosity • Despite summarizing, output is still verbose # perf report -n -stdio […] # Overhead Samples Command Shared Object Symbol # ........ ............ ....... ................. ............................. # 20.42% 605 bash [kernel.kallsyms] [k] xen_hypercall_xen_version | --- xen_hypercall_xen_version check_events | |--44.13%-- syscall_trace_enter | tracesys | | | |--35.58%-- __GI___libc_fcntl | | | | | |--65.26%-- do_redirection_internal | | | do_redirections | | | execute_builtin_or_function | | | execute_simple_command [… ~13,000 lines truncated …]
Full perf report Output
… as a Flame Graph
Flame Graphs git clone --depth 1 https://github.com/brendangregg/FlameGraph cd FlameGraph perf record -F 99 -a –g -- sleep 30 perf script | ./stackcollapse-perf.pl | ./flamegraph.pl > perf.svg • Flame Graphs: – x-axis : alphabetical stack sort, to maximize merging – y-axis : stack depth – color : random (default), or a dimension • Currently made from Perl + SVG + JavaScript – Multiple d3 versions are being developed • Easy to get working – http://www.brendangregg.com/FlameGraphs/cpuflamegraphs.html – Above commands are Linux; see URL for other OSes
Linux perf_events Workflow list events count events capture stacks perf list perf stat perf record Typical Workflow perf.data ¡ text UI dump profile perf report perf script stackcollapse-perf.pl flame graph visualization flamegraph.pl
Flame Graph Interpretation g() e() f() d() c() i() b() h() a()
Flame Graph Interpretation (1/3) Top edge shows who is running on-CPU, and how much (width) g() e() f() d() c() i() b() h() a()
Flame Graph Interpretation (2/3) Top-down shows ancestry e.g., from g(): g() e() f() d() c() i() b() h() a()
Flame Graph Interpretation (3/3) Widths are proportional to presence in samples e.g., comparing b() to h() (incl. children) g() e() f() d() c() i() b() h() a()
Flame Graph Colors • Randomized by default • Can be used as a dimension. e.g.: – Mixed-mode flame graphs – Differential flame graphs – Search
Recommend
More recommend
Explore More Topics
Stay informed with curated content and fresh updates.

