Introducing Java Profiling via Flame Graphs Agustn Gallego Support - PowerPoint PPT Presentation
Introducing Java Profiling via Flame Graphs Agustn Gallego Support Engineer - Percona Agenda What are Flame Graphs? What is the USE method? Setting up the environment Basic usage A case study There's even more
Introducing Java Profiling via Flame Graphs Agustín Gallego Support Engineer - Percona
Agenda • What are Flame Graphs? • What is the USE method? • Setting up the environment • Basic usage • A case study • There's even more to it! Advanced usage � 2
But First... • Credit where credit is due! • I'm basing on the work of Brendan Gregg, who has talked extensively on this subject, and has a plethora of data on his website: http://www.brendangregg.com/perf.html http://www.brendangregg.com/perf.html#FlameGraphs • Bear with me while I tangentially miss Java a bit... � 3
What Are Flame Graphs?
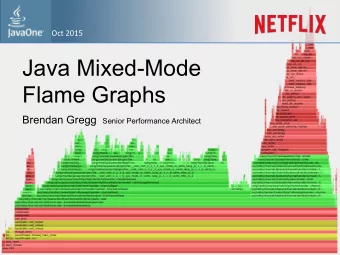
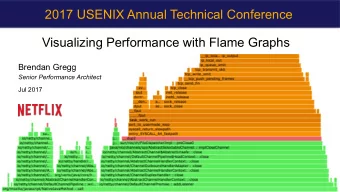
Introducing Flame Graphs • Flame Graphs are a way to visualize data • Provide an easy-to-understand interface for otherwise hard-to-read data • They consume perf outputs (text) • Generate outputs in .svg format (Scalable Vector Graphics) • in technicolor! • interactive • supported by all modern browsers � 5
Introducing Flame Graphs � 6
Introducing Flame Graphs • What can we say about the state of this server? � 7
Introducing Flame Graphs • Since .svg files have many interactive features, let's switch to a web browser window for a minute � 8
A Handy View of Resources http://www.brendangregg.com/perf_events/perf_events_map.png � 9
What is the USE Method?
The USE method • A systematic approach to performance analysis • Why USE? • Utilization • Saturation • Errors • Why is it important? • Flame Graphs are about context • To have more data to base your collection and observations on � 11
A Quick Example agustin@bm-support01 ~ $ vmstat 1 10 procs -----------memory-------------- ---swap-- -----io--- --system--- ------cpu----- r b swpd free buff cache si so bi bo in cs us sy id wa st 5 0 21356 2722844 3344532 130780832 0 0 114 151 0 0 4 4 92 0 0 6 0 21356 2722532 3344532 130780992 0 0 0 584 31699 20073 1 22 78 0 0 5 0 21356 2722840 3344532 130780992 0 0 0 32 31417 20189 1 22 78 0 0 5 0 21356 2723148 3344532 130780992 0 0 0 200 31548 21719 1 22 78 0 0 5 0 21356 2723660 3344532 130780992 0 0 0 452 31272 20505 1 21 78 0 0 5 0 21356 2723904 3344532 130781040 0 0 0 661 31663 21971 1 22 77 0 0 5 0 21356 2706268 3344532 130780832 0 0 0 725 31492 21207 2 22 75 0 0 9 0 21356 2706428 3344532 130780840 0 0 0 96 31484 22362 2 22 76 0 0 7 0 21356 2714484 3344532 130780880 0 0 0 117 31349 22867 2 25 73 0 0 6 0 21356 2713240 3344532 130781696 0 0 0 60 31157 20429 2 25 74 0 0 � 12
Setting up the Environment
Installing Packages • Dependencies needed: • perf_events (or just perf) - performance monitoring for Linux kernel • yum install perf • Flame Graphs project • git clone https://github.com/brendangregg/FlameGraph.git • perf support for Java JIT • perf-map-agent • and use -XX:+PreserveFramePointer JVM option (8u60+) • symbols for any other code we want to profile � 14
Without perf-map-agent • We will get the following message when trying to process perf record output: $ sudo perf script > perf.script.out Failed to open /tmp/perf-38304.map, continuing without symbols � 15
Basic Usage
Basic Usage • Record profile (use root / sudo): perf record -F 99 -a -g -- sleep 10 • Make the recorded samples readable (use root / sudo): perf script > perf.script.out • Collapse stacks into a single line plus counters stackcollapse-perf.pl perf.script.out > perf.folded.out • Generate the svg Flame Graph file flamegraph.pl perf.folded.out > perf.flamegraph.svg � 17
Basic Usage • Let's go back to the Flame Graph • explain the amount of samples it can actually aggregate • why the different colors shown? • why is it showing functions in alphabetical order (per level)? • why is it not using time for X-axis? • show how to search for functions (and see percentages for them) • zoom in/out � 18
A Case Study
A Case Study • We will do a short demo on a case study: • (optional: initial approach via the USE method) • capturing perf data • generating Flame Graphs to help assess profiled data captured • going back to the code to see how to improve it � 20
A Case Study agustin@bm-support01 ps_5.7.25 $ time for i in {1..1000}; do \ { ./use -e "SELECT 1;" test >/dev/null; } done real 0m9.863s user 0m4.603s sys 0m5.163s agustin@bm-support01 ps_5.7.25 $ time (for i in {1..1000}; do \ { echo "SELECT 1;"; } done) | ./use test >/dev/null real 0m0.074s user 0m0.018s sys 0m0.017s � 21
There's Even More to it! Advanced Usage
Advanced Usage • Expanding our horizons: • filtering by event type / subsystem • perf record ... -e '<type>' • using coloring schemes for different applications • --colors • creating diffs between samples (differential flame graphs and color diffs) • flamegraph.pl --cp sample1.folded.out > perf.flamegraph.out • flamegraph.pl --cp --colors blue sample2.folded.out > perf.flamegraph.diff.out � 23
Advanced Usage • Expanding our horizons: • cleaning samples • grep -v cpu_idle perf.folded.out • sed -E 's/\+0x[0-9]+//g' < perf.folded.out > perf.folded.nohexaddr.out • icicle graphs (grouping top-down instead of bottom-up) • --reverse --inverted � 24
Advanced Usage • In more recent Linux versions, there is better support: • 4.5 perf report has support for folding samples (more on it here) • 4.8 stack frame limit extended • 4.9 supports in-kernel aggregation, so it can be consumed directly by the flamegraph.pl script � 25
Java Package Flame Graph perf record -F 99 -a -- sleep 30; jmaps perf script | pkgsplit-perf.pl | grep java > java_folded.out flamegraph.pl java_folded.out > out.svg • There is no need to collect stack traces (-g argument) • No need to run Java with -XX:+PreserveFramePointer • Useful to see how each individual package behaves • Full flame graphs will contain times for the children, not only the function itself, which may not be wanted/needed � 26
Thanks! Questions? And just two more slides left...
Thank You to Our Sponsors
Rate My Session � 29
Recommend
More recommend
Explore More Topics
Stay informed with curated content and fresh updates.



![SmokeScreen Silver A Market $360 Million Growing Pyrotechnics Display Industry [1] Product Need](https://c.sambuz.com/879056/smokescreen-s.webp)
