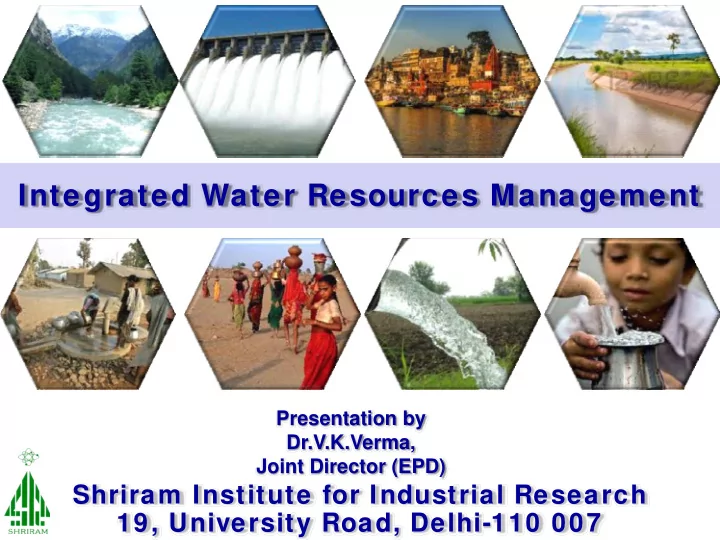

Integrated Water Resources Management Presentation by Dr.V.K.Verma, Joint Director (EPD) Shriram Institute for Industrial Research 19, University Road, Delhi-110 007
Conserve each and every drop !!!
What is happening, Now ? � Inflow of untreated sew age & industrial effluent � Poor Catchment due to ♦ Non-point Pollution sources (Open defecation, Cattle farms etc.) ♦ Leaching from indiscriminate solid waste dumping. ♦ Run-off from agricultural fields.
Water Management Challenges in India Groundw ater Surface Water � Over-exploitation � Non-point Pollution � Contamination � Untreated Discharge Need for Technological Innovation, Adaptation & Sustainability Wastew ater Treatment Water Quality Monitoring � Urban Areas (30-35%) � Lack of Reliable Data � Performance Varies � Lack of Infrastructure Need for Integrated Water Resources Management !!
Water Budget : India Availability Average Annual Precipitation of Water in including Snowfall 4000 BCM India Average Annual Natural Flow to Rivers & Aquifers Losses � Runoff/ Percolation 1869 BCM � Evapo-transpiration Actual utilization due to natural constrains Balance Annual GW 1123 BCM replenishable Draft 153 BCM 245 BCM Ground Water Surface Water 35 BCM 433 BCM 690 BCM Natural Discharge Water Resources are highly stressed !!
Why Water Resources Management ? Irrigation Purpose Industrial Applications Water is Essential for Sustenance of Life Domestic Use Infrastructural Projects Major Issues : � Water Scarcity Needs to be addressed ! � Water Contamination/ Pollution � Water Quality Varies Widely
State-w ise Stages of Groundw ater Development Over Exploited Critical Semi Critical Safe Major Hotspots are Delhi, Haryana, Punjab & Rajasthan followed by Gujarat, Tamilnadu, U.P & Karnataka
Groundw ater Contamination in India N S N N N S S N N N N S S N Entire Country N is Affected N N N (Alarming N S N Situation) N N S S N N S Arsenic Geogenic (Alluvium & Volcanic Rocks) N S Fluoride Geogenic (Fluoride bearing rocks/minerals) S Iron Many hydrogeological conditions N N Nitrate (All States Affected) Mostly Anthropogenic N Inland Salinity S Natural & Anthropogenic Coastal Salinity (Coastal areas) Natural & Anthropogenic
River Basins in India Ganga River Basin is the largest % contribution in sectoral water demand Due to Population Pressure & Growing Water Demand : River Basins are moving towards stress !!!
Sew age Generation & Treatment in Ganga Basin States (Urban Areas Only) � Sew age Generation in Ganga Basin States : 27068 MLD � Existing Operation Capacity : 7356 MLD (27.2 % only) � Maximum operational capacity 2671 MLD in Delhi
State-w ise Sew age Treatment Status (Urban Areas of India as on 2015) Sew age Treatment Essential for IWRS
Actual Sew age Treatment in Urban Areas of Country Treatment Capacity 23277 MLD (39%) No Treatment 39723 MLD (61%) Sewage Generation in Urban Area 61000 MLD Intense Need for Augmentation
Faecal Coliforms in River Ganga Water : Study by SRI (2013-16) Most of the time found above 10 3 range Alarming Situation !!
WQI of River Ganga : Study by SRI (2013-16) WATER Rishikesh Hardwar Kanpur Allahabad Varanasi Patna Howrah CLASS 100 90 A 80 70 B 60 50 C 40 D 30 E 20 10 0 2013 2014 2015 2016 NSF-WQI (based on FC, Description of Class by Remarks BOD 5d/20°C , DO & pH) Water Quality CPCB 63-100 Good to Excellent A Non-polluted 50-63 Medium to Good B 38-50 Bad C 38 & Less Bad to Very Bad D, E Heavily Polluted
Common Effluent Treatment Plants 1 in Ganga Basin States 4 14 12 14 8 � 59 CETPs in 9 States � 12 CETPs in Delhi � 14 each in HR & RAJ 1 1 1 SRI conducted study of CETPs in Delhi � Total Capacity : 177.3 MLD � Operational Capacity : 47.6 MLD � % Utilization : 26.9 � Utilization Range : 10.5 – 89.2% Effluent Untapped & discharged untreated
No. of Water Sources including Schemes in habitations & Status of Water Testing for Safety Evaluation (2015-16) : All India Testing is ESSENTIAL for EARLY WARNING !!!
Integrated Water Resources Management (How to Achieve Set Objectives?) Water Withdraw al Replenishment Domestic Industry Irrigation Safety & Quality Evaluation for Better Management Effective Waste Water Treatment
Components of IRWM Topography Vegetation Geology Climate Human & Basin Organizational Technology Organization Capacity Human Science Availability of fresh Based Water IRWM water of appropriate Decision Needs quality Making Basin Level Policy, Legal Stakeholder Management & Regulatory Involvement Activities Framework Three Basic Pillars of IRWM Aquatic Appropriate Ecosystem � Enabling Environment flow to & � Institutional Roles Coastal Biodiversity Areas � Management Instruments needs
Kofi Annan : The Secretary-General of the United Nations (January 1997 to December 2006)
Way Forward � Participation of Everyone To Achieve � Institutional Strengthening Objectives of IWRM � Capacity Building
Thanks
Recommend
More recommend