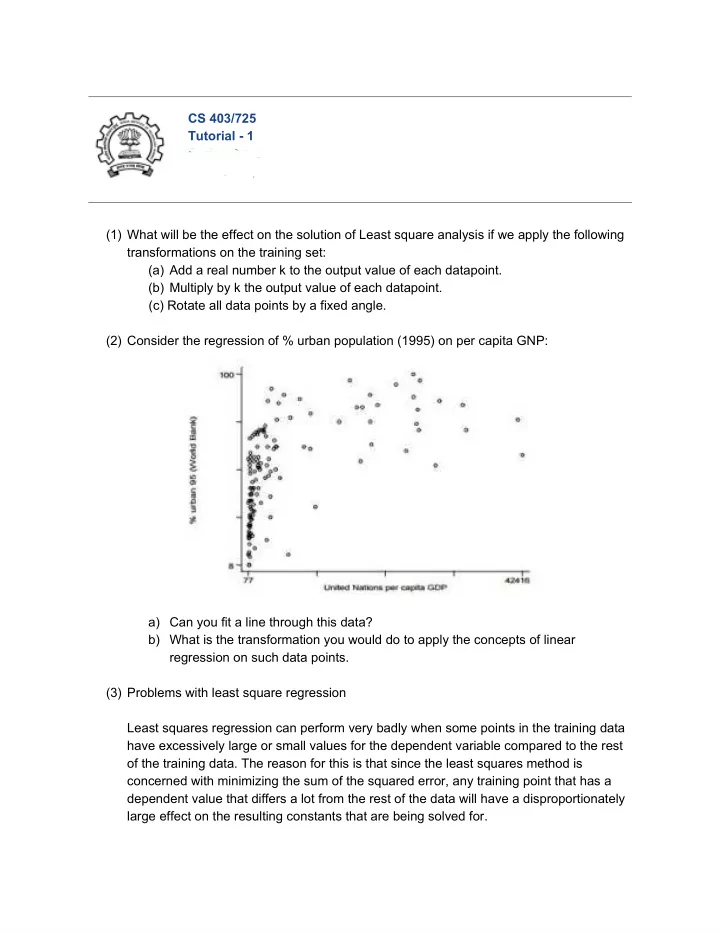

CS 403/725 Tutorial - 1 Spring 2016 IIIIIIII aa aaaa IIT Bombay (1) What will be the effect on the solution of Least square analysis if we apply the following transformations on the training set: (a) Add a real number k to the output value of each datapoint. (b) Multiply by k the output value of each datapoint. (c) Rotate all data points by a fixed angle. (2) Consider the regression of % urban population (1995) on per capita GNP: a) Can you fit a line through this data? b) What is the transformation you would do to apply the concepts of linear regression on such data points. (3) Problems with least square regression Least squares regression can perform very badly when some points in the training data have excessively large or small values for the dependent variable compared to the rest of the training data. The reason for this is that since the least squares method is concerned with minimizing the sum of the squared error, any training point that has a dependent value that differs a lot from the rest of the data will have a disproportionately large effect on the resulting constants that are being solved for.
Consider an Example: Suppose we would like to predict height of a person based on his weight and age. Fig 2 shows the linear regression line (hyperplane) through the data. Fig. 2 Fig 3 Now if we have an outlier i.e. a 10 foot tall 40 year old who weighs 200 pounds man (shown as green) in our original data the figure would look like fig 3. Below we have a plot of the old least squares solution (in blue) prior to adding the outlier point to our training set, and the new least squares solution (in green) which is attained after the outlier is added:
As you can see in the image above, the outlier we added dramatically distorts the least squares solution and hence will lead to much less accurate predictions. Suggest some methods to improve the optimization function in the linear regression to work around this problem. (Hint: It should be noted that bad outliers can sometimes lead to excessively large regression constants we would like to fix this problem) [src: clockbackward.com] (4) We propose a modification to the least square regression formulation: Instead of taking the squared sum of the error values, we will instead raise their absolute value to the power of p. p is a parameter which we can tune. a. For least squares, p = 2. If we change p what problems do you think we can run into? b. How will you implement the method for a general p? Can you find a closed formula? c. Take-home question: It is observed that if p < 2 then the method tends to be more robust to outliers. Can you think of an experiment to test this?
Recommend
More recommend