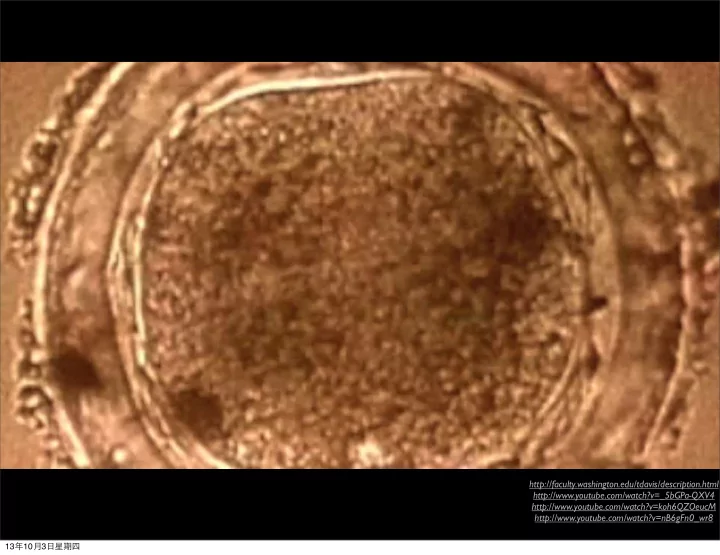

Experimental Achievements 13 年 10 月 3 ⽇旦星期四
13 年 10 月 3 ⽇旦星期四
Part Standardization RFC[23] 13 年 10 月 3 ⽇旦星期四
Fluorescent Proteins Figure. Fluorescent proteins: GFP, RFP, mOrange 13 年 10 月 3 ⽇旦星期四
Fluorescent Proteins Figure . Fluorescent proteins have be modified to RFC[23], and stop codons have been removed for fusion protein purpose 13 年 10 月 3 ⽇旦星期四
13 年 10 月 3 ⽇旦星期四
Promoters 13 年 10 月 3 ⽇旦星期四
clb6 Promoter Figure . Bright field of budding yeast 13 年 10 月 3 ⽇旦星期四
clb6 Promoter Figure . Bright field of budding yeast 13 年 10 月 3 ⽇旦星期四
clb6 Promoter Figure . Bright field of budding yeast 13 年 10 月 3 ⽇旦星期四
Figure . Clb6 promoter for G1 phase has been verified 13 年 10 月 3 ⽇旦星期四
cln3 Promoter Figure . Flow cytometry to verify S phase promoter cln3 13 年 10 月 3 ⽇旦星期四
13 年 10 月 3 ⽇旦星期四
Targeting Peptides 13 年 10 月 3 ⽇旦星期四
Figure . Test for targeting peptides to mitochondria, nucleus and vacuolar 13 年 10 月 3 ⽇旦星期四
13 年 10 月 3 ⽇旦星期四
Degradation Tags 13 年 10 月 3 ⽇旦星期四
Growth Curve Figure . Growing curve of budding yeast Figure . Growing curve of E. coli 13 年 10 月 3 ⽇旦星期四
Degradation Tag E.coli Negative Control Very Fast Fast Moderate Positive Control Figure . Fluorescence ladder for degradation test devices 13 年 10 月 3 ⽇旦星期四
Positive Control K1051257 K1051258 K1051259 Figure . The test results for degradation tags 13 年 10 月 3 ⽇旦星期四
Degradation Tag E.coli Figure . Fluorescence intensity calculated by ImageJ and degradation rates calculation. 13 年 10 月 3 ⽇旦星期四
Dynamic Measurement Figure . Genetic circuit of K1051258 Input1: LB Output Input2: LB Figure . Microfluidics +1mM IPTG 13 年 10 月 3 ⽇旦星期四
Degradation Tag E.coli Figure . The test results of BBa_K1051258 in chip. A,LB medium,0 minute; B, IPTG medium,9minutes; C, IPTG medium, 15 minutes. 13 年 10 月 3 ⽇旦星期四
Degradation Tag E.coli Figure . Average fluorescence intensity of K1051258 measurement 13 年 10 月 3 ⽇旦星期四
Measurement Figure . RFP with degradation tag’s half life tested by microfluidics and calculated by model 13 年 10 月 3 ⽇旦星期四
Data Match Figure . Degradation rate result comparison 13 年 10 月 3 ⽇旦星期四
13 年 10 月 3 ⽇旦星期四
Synchronization Device 13 年 10 月 3 ⽇旦星期四
Mutant Work of SIC1 Problems in SOE-PCR so up to now Overlap: 22bp 628bp 249bp 13 年 10 月 3 ⽇旦星期四
Mutant Work of SIC1 Problems in SOE-PCR so up to now Overlap: 22bp 628bp 249bp 累觉不爱。。。 13 年 10 月 3 ⽇旦星期四
Synchronization by Microfluidics Input: YPD medium 90min Input: Dilute YDP medium 60min 13 年 10 月 3 ⽇旦星期四
Recommend
More recommend